
 Yahoo Finance
 What’s going on with bitcoin? Cryptocurrency is following price prediction model ‘with astonishing precision’
Bitcoin’s recent price crash, which saw it lose a quarter of its value after hitting an all-time high, could be just the “midway dip” in a new record-breaking rally if market patterns from 2013 and 2017 are repeated.
This is the view of a number of prominent cryptocurrency analysts, who adhere to a “stock-to-flow” model dictated by bitcoin’s inbuilt scarcity.
The model is based on the relationship between the existing stockpiles of bitcoin and the yearly production rate of new bitcoins through digital mining. Roughly every four years, a “halving” event occurs that reduces the rewards for mining the cryptocurrency by 50 per cent. After the first halving in 2012, bitcoin’s price rose from around $11 to $1,100 before falling back down. The second halving in 2016 saw bitcoin’s price rise from $500 to $20,000 before dipping again.
Watch: What are the risks of investing in cryptocurrency?
The most recent halving event took place in May 2020, right at the beginning of the latest price rally. It has since risen from below $10,000 to the new all-time high of $64,863 that it hit this month. After briefly falling below $48,000, it has since recovered slightly to $55,000 at the time of writing.
This latest dip appears to be similar in scale and timing to other dips experienced following the 2012 and 2016 halvings.
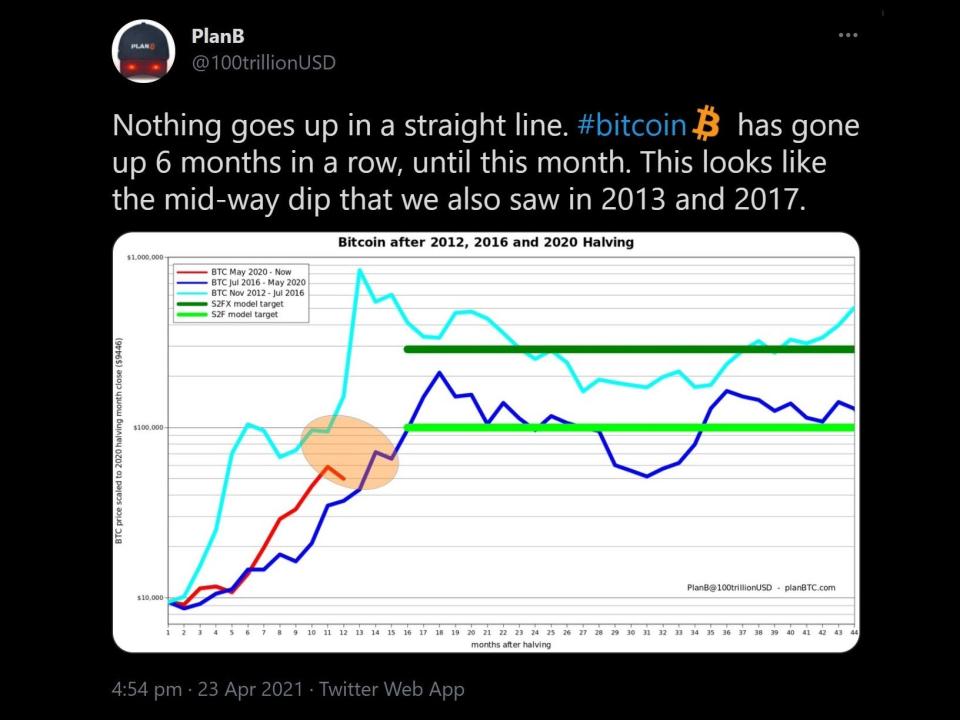
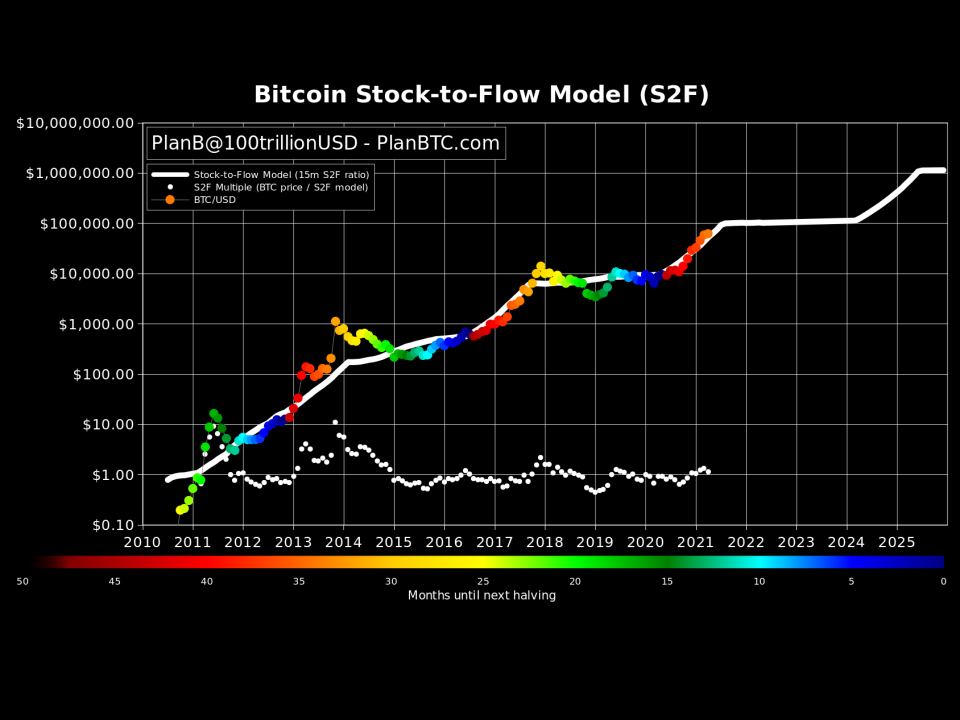
The creator of this stock-to-flow model is the Netherlands-based analyst ‘PlanB’, whose most recent projections suggest that bitcoin is still only trading at a fraction of its next major peak.
A graph plotting bitcoin’s value over time on a logarithmic scale (where its value increases by increments of 10x) shows that the cryptocurrency has largely followed a linear progression since its inception in 2009.
In his original stock-to-flow model from March 2019, PlanB noted that irregularities could be attributed to various external forces – as evidenced by the pandemic-induced market crash in early 2020 – but that ultimately bitcoin’s fixed supply is the main driver of price movements in the long term.
“Other factors also impact price – regulation, hacks and other news – that is why it is not 100 per cent (and not all dots are on the line),” he wrote. “However, the dominant driving factor seems to be scarcity.”
Dr Saifedean Ammous, economist and author of The Bitcoin Standard, also noticed similarities between the recent price crash and the previous post-halving rallies.
“More than two years after this model was published, the price continues to track the model’s predictions with astonishing precision,” he tweeted in response to the latest dip.
Another analyst noted: “This is starting to play out scary close.”
Following bitcoin’s price crash in March 2020, which saw it briefly dip below $5,000, PlanB stood by the model and its forecast that the cryptocurrency will hit $100,000 at some point in 2021.
A month after the 2020 crash, he went even further by releasing a revised version of this stock-to-flow model that put bitcoin’s trajectory on course for $288,000.

A market report by cryptocurrency exchange Luno soon after cited the stock-to-flow model, stating: “Based on bitcoin’s historical data, it may be a lucrative level to accumulate more bitcoin now.”
At the time, one bitcoin was worth just $7,000.
Konstantin Anissimov, executive director at London-based cryptocurrency exchange CEX.IO, in another figure within the cryptocurrency industry to praise the accuracy of the model and its apparent ability to predict future prices.
“The stock-to-flow model has been extremely accurate at anticipating bitcoin’s future price action as a direct result of the supply shock it experiences following each halving,” he told The Independent.
“Based on this fundamental indicator, bitcoin’s scarcity is highly correlated with the value of the network. As the cryptocurrency’s rate of production dropped to 328,500 new tokens per annum last August, such a significant cut had a serious implication on prices.”
#bitcoin linear scale by epoch - Each epoch scale is 20x the prior one
1st draft - feedback welcome pic.twitter.com/Bu5i8Z3QIr— ChartsBTC (@ChartsBtc) March 28, 2021
The final halving event is expected to occur at some point in 2140, at which point all 21 million bitcoins will have been mined into existence.
Estimates for what bitcoin will be worth by then range from $0 to $100 trillion in terms of its overall market cap – putting it on par with the global real estate market.
Whatever bitcoin’s eventual peak ends up being, there is another pattern that has appeared without fail during every halving cycle so far: Each record-breaking high has been followed by a record-breaking crash.
Watch: What is bitcoin?
Read More
Bitcoin price live: Cryptocurrency value surges as Elon Musk tweet sends Dogecoin soaring
Dogecoin price sky rockets after Elon Musk calls himself ‘The Dogefather’
Microsoft Teams down: Users around the world faced outages
