
 Yahoo Finance
 Gold Price Futures (GC) Technical Analysis – Strengthens Over $1787.00, Weakens Under $1780.90
Stronger demand for risky assets and firm U.S. Treasury yields are capping gold prices on Monday, while a weaker U.S. Dollar could be slowing down the selling pressure. Traders seem to be shrugging off concerns over another surge in U.S. COVID-19 cases.
Gold traders appear to be sitting on the fence at this time with bullish traders citing a resurgence in coronavirus cases as a reason for higher prices, while bearish traders are saying COVID won’t be an issue as long as the economic data continues to show improvement.
At 11:29 GMT, August Comex gold is trading $1786.30, down $3.70 or -0.21%.
Later today, investors will get the opportunity to react to the ISM Non-Manufacturing PMI report. Economists polled by Reuters expect the report to rise to 50 in June from 45.4, signaling a revival in economic activity.
Daily Swing Chart Technical Analysis
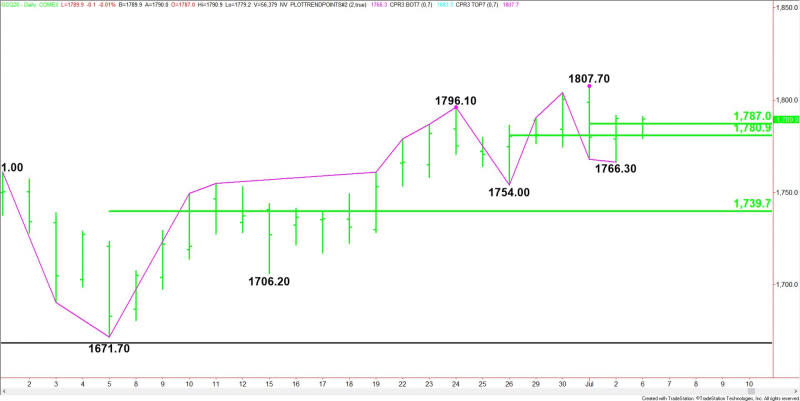
The main trend is up according to the daily chart, however, momentum starting trending lower on July 1 with the formation of a closing price reversal top.
A trade through $1807.70 will negate the closing price reversal top and signal a resumption of the uptrend. The main trend changes to down on a trade through $1754.00.
The first minor range is $1807.70 to $1766.30. Its 50% level or pivot comes in at $1787.00.
The second minor range is $1754.00 to $1807.70. Its 50% level or pivot comes in at $1780.90.
The main range is $1671.70 to $1807.70. If the trend changes to down then look for a test of its 50% level at $1739.70.
Daily Swing Chart Technical Forecast
Based on the early price action and the current price at $1786.30, the direction of the August Comex gold futures contract the rest of the session on Monday will likely be determined by the pair of 50% levels at $1787.00 and $1780.90.
Bullish Scenario
A sustained move over $1787.00 will indicate the presence of buyers. Taking out Thursday’s high at $1791.70 will indicate the buying is getting stronger. However, it’s going to take a surge in buying to trigger a retest of $1807.70.
Bearish Scenario
A break under $1787.00 will be the first sign of weakness. A sustained move under $1780.90 will indicate the selling pressure is getting stronger. This could trigger a further break into the July 2 low at $1766.30. This is the last potential support before the $1754.00 main bottom.
For a look at all of today’s economic events, check out our economic calendar.
This article was originally posted on FX Empire
More From FXEMPIRE:
Crude Oil Price Update – Trader Reaction to $40.65 Sets the Tone
Silver Price Forecast – Silver Markets Continue to Stretch Higher
E-mini S&P 500 Index (ES) Futures Technical Analysis – Traders Have Sights Set on 3220.50
GBP/JPY Price Forecast – British Pound Continues to See Volatility Against Yen
GBP/USD Price Forecast – British Pound Rallies Into the Same Area on Monday
The Bearish Combination of Soaring Silver and Lagging Miners
