
 Yahoo Finance
 Gold Price Futures (GC) Technical Analysis – May 24, 2018 Forecast
June Comex Gold futures are trading higher on Wednesday. The market is being supported by a weaker U.S. Dollar, a drop in Treasury yields and renewed geopolitical tensions.
Gold prices are inching higher for a second day helped by the minutes of the latest Federal Reserve meeting that hinted at a dovish approach to interest rate hikes in the United States.
As far as geopolitical tensions are concerned, U.S. President Donald Trump said on Wednesday he would know next week whether his summit with North Korean leader Kim Jong Un would take place as scheduled, casting further doubt on plans for the unprecedented meeting.
Daily Swing Chart Technical Analysis
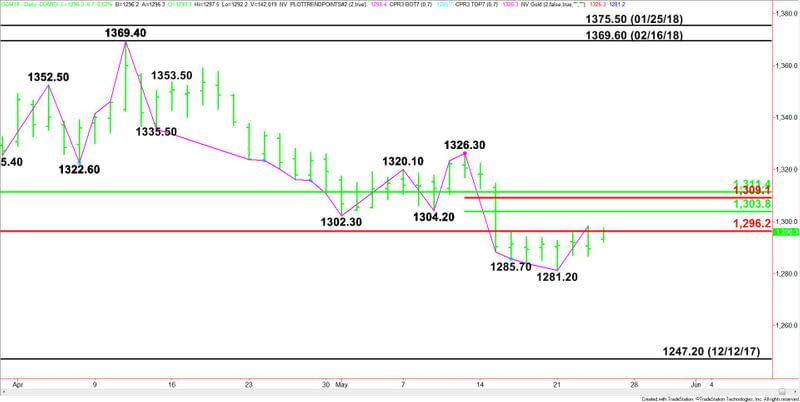
The main trend is down according to the daily swing chart. A trade through $1281.20 will signal a resumption of the downtrend.
The main range is $1375.50 to $1347.20. Its retracement zone at $1296.20 to $1311.40 is controlling the near-term direction of the market. Traders should treat these levels like resistance.
The short-term range is $1326.30 to $1281.20. Its retracement zone at $1303.80 to $1309.10 is the primary upside target. Since the main trend is down, sellers are likely to come in on a test of this area.
Combining the two retracement zones creates a price cluster at $1309.10 to $1311.40. This is the strongest resistance.
Daily Swing Chart Technical Forecast
Based on the early price action, the direction of the gold market the rest of the session is likely to be determined by trader reaction to the major Fibonacci level at $1296.20.
A sustained move under $1296.20 will signal the presence of sellers. If this generates enough downside momentum then look for a retest of $1281.20. This is a possible trigger point for an acceleration to the downside with $1247.20 the next major downside target.
A sustained move over $1296.20 will indicate the presence of buyers. This could trigger a labored rally into a series of retracement levels at $1303.80, $1309.10 and $1311.40. The latter is the trigger point for a possible acceleration into the $1326.30 main top.
This article was originally posted on FX Empire
