
 Yahoo Finance
 The Goldman Sachs Group, Inc.'s (NYSE:GS) Low P/E No Reason For Excitement
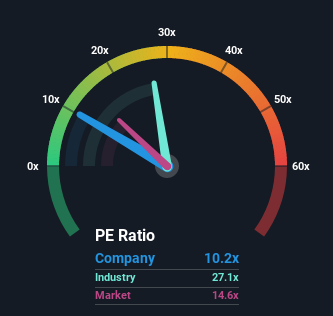
With a price-to-earnings (or "P/E") ratio of 10.2x The Goldman Sachs Group, Inc. (NYSE:GS) may be sending bullish signals at the moment, given that almost half of all companies in the United States have P/E ratios greater than 15x and even P/E's higher than 29x are not unusual. Although, it's not wise to just take the P/E at face value as there may be an explanation why it's limited.
Goldman Sachs Group hasn't been tracking well recently as its declining earnings compare poorly to other companies, which have seen some growth on average. The P/E is probably low because investors think this poor earnings performance isn't going to get any better. If you still like the company, you'd be hoping this isn't the case so that you could potentially pick up some stock while it's out of favour.
See our latest analysis for Goldman Sachs Group
Want the full picture on analyst estimates for the company? Then our free report on Goldman Sachs Group will help you uncover what's on the horizon.
Does Growth Match The Low P/E?
Goldman Sachs Group's P/E ratio would be typical for a company that's only expected to deliver limited growth, and importantly, perform worse than the market.
Retrospectively, the last year delivered a frustrating 38% decrease to the company's bottom line. Still, the latest three year period has seen an excellent 67% overall rise in EPS, in spite of its unsatisfying short-term performance. So we can start by confirming that the company has generally done a very good job of growing earnings over that time, even though it had some hiccups along the way.
Shifting to the future, estimates from the analysts covering the company suggest earnings growth is heading into negative territory, declining 0.07% each year over the next three years. Meanwhile, the broader market is forecast to expand by 9.0% per annum, which paints a poor picture.
In light of this, it's understandable that Goldman Sachs Group's P/E would sit below the majority of other companies. However, shrinking earnings are unlikely to lead to a stable P/E over the longer term. There's potential for the P/E to fall to even lower levels if the company doesn't improve its profitability.
What We Can Learn From Goldman Sachs Group's P/E?
Generally, our preference is to limit the use of the price-to-earnings ratio to establishing what the market thinks about the overall health of a company.
We've established that Goldman Sachs Group maintains its low P/E on the weakness of its forecast for sliding earnings, as expected. At this stage investors feel the potential for an improvement in earnings isn't great enough to justify a higher P/E ratio. It's hard to see the share price rising strongly in the near future under these circumstances.
There are also other vital risk factors to consider before investing and we've discovered 2 warning signs for Goldman Sachs Group that you should be aware of.
You might be able to find a better investment than Goldman Sachs Group. If you want a selection of possible candidates, check out this free list of interesting companies that trade on a P/E below 20x (but have proven they can grow earnings).
Have feedback on this article? Concerned about the content? Get in touch with us directly. Alternatively, email editorial-team (at) simplywallst.com.
This article by Simply Wall St is general in nature. We provide commentary based on historical data and analyst forecasts only using an unbiased methodology and our articles are not intended to be financial advice. It does not constitute a recommendation to buy or sell any stock, and does not take account of your objectives, or your financial situation. We aim to bring you long-term focused analysis driven by fundamental data. Note that our analysis may not factor in the latest price-sensitive company announcements or qualitative material. Simply Wall St has no position in any stocks mentioned.
Join A Paid User Research Session
You’ll receive a US$30 Amazon Gift card for 1 hour of your time while helping us build better investing tools for the individual investors like yourself. Sign up here
