
 Yahoo Finance
 Is Goldman Sachs Losing Its Mojo on Wall Street?
Something is going on at Goldman Sachs (NYSE: GS).
The investment bank, long known for operating one of the biggest and most profitable trading operations on Wall Street, has seen that business plummet over the past year.

On Tuesday, Goldman reported that total sales and trading revenue fell 17% in the latest quarter. Its bread-and-butter bond trading was down 26%.
It was the third consecutive quarter that trading revenues fell at Goldman Sachs on a year-over-year basis.
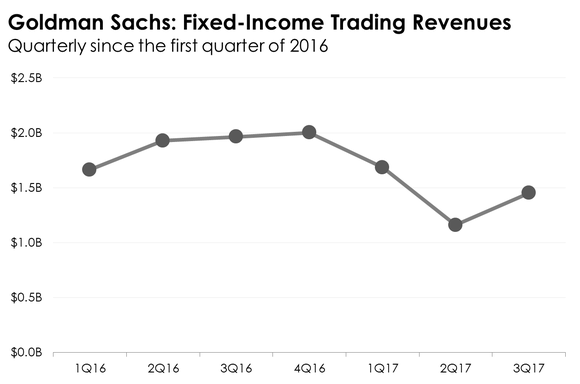
In Goldman Sachs' third-quarter earnings release, the investment bank attributed the drop to a "challenging environment characterized by low volatility and client activity."
You can get a sense for this by looking at the average daily trading volume in the U.S. bond markets, which has trended lower since the financial crisis. As of September, trading in the bond markets is down 25% since 2007.
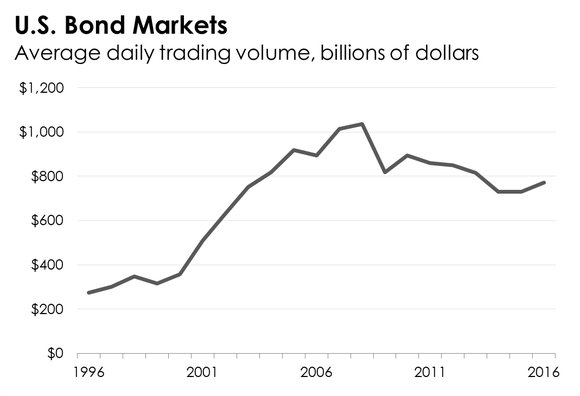
This helps explain Goldman's predicament, but it doesn't offer a full answer. It comes up short because it doesn't explain why trading volumes are down so much, specifically, since the end of last year.
For this, one can take a hint from the VIX. This is an index that tracks expected volatility in the stock market. This, too, has been especially low this year.
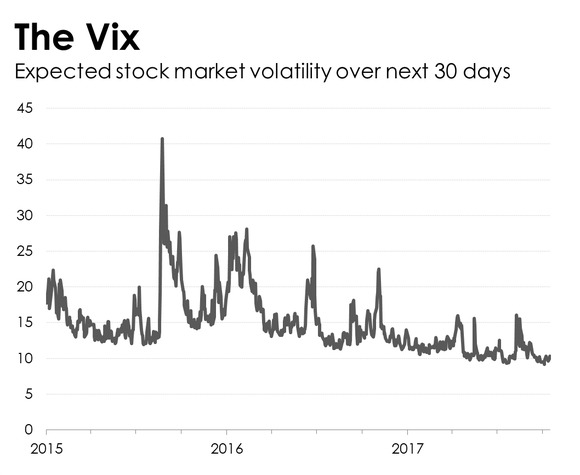
The one common denominator seems to be the presidential election, the surprise outcome of which seems to have increased uncertainty in the markets and economy, be it over tax policy, foreign policy, or regulatory policy.
Commercial banks have seen this with a slowdown in lending. Now investment banks like Goldman Sachs may be seeing it reflected in lower activity throughout the rest of the credit markets.
More From The Motley Fool
Why You're Smart to Buy Shopify Inc. (US) -- Despite Citron's Report
6 Years Later, 6 Charts That Show How Far Apple, Inc. Has Come Since Steve Jobs' Passing
NVIDIA Scores 2 Drone Wins -- Including the AI for an E-Commerce Giant's Delivery Drones
John Maxfield has no position in any of the stocks mentioned. The Motley Fool has no position in any of the stocks mentioned. The Motley Fool has a disclosure policy.
