
 Yahoo Finance
 Goldplat (LON:GDP) Knows How To Allocate Capital Effectively
What are the early trends we should look for to identify a stock that could multiply in value over the long term? In a perfect world, we'd like to see a company investing more capital into its business and ideally the returns earned from that capital are also increasing. Basically this means that a company has profitable initiatives that it can continue to reinvest in, which is a trait of a compounding machine. So when we looked at the ROCE trend of Goldplat (LON:GDP) we really liked what we saw.
Understanding Return On Capital Employed (ROCE)
For those who don't know, ROCE is a measure of a company's yearly pre-tax profit (its return), relative to the capital employed in the business. Analysts use this formula to calculate it for Goldplat:
Return on Capital Employed = Earnings Before Interest and Tax (EBIT) ÷ (Total Assets - Current Liabilities)
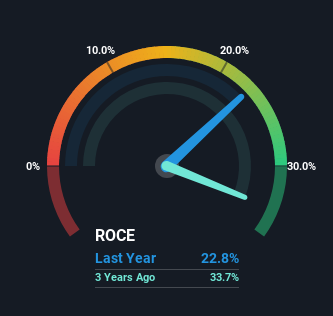
0.23 = UK£4.3m ÷ (UK£63m - UK£45m) (Based on the trailing twelve months to June 2023).
Thus, Goldplat has an ROCE of 23%. In absolute terms that's a great return and it's even better than the Metals and Mining industry average of 7.7%.
Check out our latest analysis for Goldplat
In the above chart we have measured Goldplat's prior ROCE against its prior performance, but the future is arguably more important. If you'd like, you can check out the forecasts from the analysts covering Goldplat here for free.
What Can We Tell From Goldplat's ROCE Trend?
Goldplat is showing promise given that its ROCE is trending up and to the right. The figures show that over the last five years, ROCE has grown 104% whilst employing roughly the same amount of capital. Basically the business is generating higher returns from the same amount of capital and that is proof that there are improvements in the company's efficiencies. On that front, things are looking good so it's worth exploring what management has said about growth plans going forward.
On a side note, we noticed that the improvement in ROCE appears to be partly fueled by an increase in current liabilities. Essentially the business now has suppliers or short-term creditors funding about 70% of its operations, which isn't ideal. Given it's pretty high ratio, we'd remind investors that having current liabilities at those levels can bring about some risks in certain businesses.
What We Can Learn From Goldplat's ROCE
In summary, we're delighted to see that Goldplat has been able to increase efficiencies and earn higher rates of return on the same amount of capital. And with a respectable 76% awarded to those who held the stock over the last five years, you could argue that these developments are starting to get the attention they deserve. In light of that, we think it's worth looking further into this stock because if Goldplat can keep these trends up, it could have a bright future ahead.
If you want to continue researching Goldplat, you might be interested to know about the 1 warning sign that our analysis has discovered.
If you want to search for more stocks that have been earning high returns, check out this free list of stocks with solid balance sheets that are also earning high returns on equity.
Have feedback on this article? Concerned about the content? Get in touch with us directly. Alternatively, email editorial-team (at) simplywallst.com.
This article by Simply Wall St is general in nature. We provide commentary based on historical data and analyst forecasts only using an unbiased methodology and our articles are not intended to be financial advice. It does not constitute a recommendation to buy or sell any stock, and does not take account of your objectives, or your financial situation. We aim to bring you long-term focused analysis driven by fundamental data. Note that our analysis may not factor in the latest price-sensitive company announcements or qualitative material. Simply Wall St has no position in any stocks mentioned.