
 Yahoo Finance
 Goldplat (LON:GDP) Is Very Good At Capital Allocation
Did you know there are some financial metrics that can provide clues of a potential multi-bagger? One common approach is to try and find a company with returns on capital employed (ROCE) that are increasing, in conjunction with a growing amount of capital employed. This shows us that it's a compounding machine, able to continually reinvest its earnings back into the business and generate higher returns. And in light of that, the trends we're seeing at Goldplat's (LON:GDP) look very promising so lets take a look.
Understanding Return On Capital Employed (ROCE)
If you haven't worked with ROCE before, it measures the 'return' (pre-tax profit) a company generates from capital employed in its business. The formula for this calculation on Goldplat is:
Return on Capital Employed = Earnings Before Interest and Tax (EBIT) ÷ (Total Assets - Current Liabilities)
0.30 = UK£5.7m ÷ (UK£33m - UK£14m) (Based on the trailing twelve months to December 2020).
So, Goldplat has an ROCE of 30%. In absolute terms that's a great return and it's even better than the Metals and Mining industry average of 17%.
See our latest analysis for Goldplat
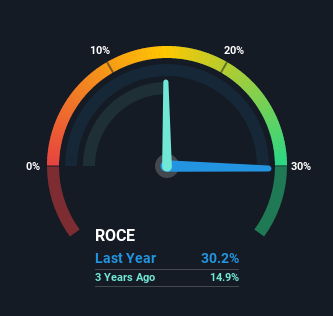
Historical performance is a great place to start when researching a stock so above you can see the gauge for Goldplat's ROCE against it's prior returns. If you'd like to look at how Goldplat has performed in the past in other metrics, you can view this free graph of past earnings, revenue and cash flow.
What The Trend Of ROCE Can Tell Us
Goldplat is showing promise given that its ROCE is trending up and to the right. Looking at the data, we can see that even though capital employed in the business has remained relatively flat, the ROCE generated has risen by 1,421% over the last five years. Basically the business is generating higher returns from the same amount of capital and that is proof that there are improvements in the company's efficiencies. It's worth looking deeper into this though because while it's great that the business is more efficient, it might also mean that going forward the areas to invest internally for the organic growth are lacking.
On a separate but related note, it's important to know that Goldplat has a current liabilities to total assets ratio of 43%, which we'd consider pretty high. This effectively means that suppliers (or short-term creditors) are funding a large portion of the business, so just be aware that this can introduce some elements of risk. Ideally we'd like to see this reduce as that would mean fewer obligations bearing risks.
In Conclusion...
To bring it all together, Goldplat has done well to increase the returns it's generating from its capital employed. Since the stock has only returned 17% to shareholders over the last five years, the promising fundamentals may not be recognized yet by investors. So with that in mind, we think the stock deserves further research.
One more thing to note, we've identified 1 warning sign with Goldplat and understanding it should be part of your investment process.
High returns are a key ingredient to strong performance, so check out our free list ofstocks earning high returns on equity with solid balance sheets.
This article by Simply Wall St is general in nature. We provide commentary based on historical data and analyst forecasts only using an unbiased methodology and our articles are not intended to be financial advice. It does not constitute a recommendation to buy or sell any stock, and does not take account of your objectives, or your financial situation. We aim to bring you long-term focused analysis driven by fundamental data. Note that our analysis may not factor in the latest price-sensitive company announcements or qualitative material. Simply Wall St has no position in any stocks mentioned.
Have feedback on this article? Concerned about the content? Get in touch with us directly. Alternatively, email editorial-team (at) simplywallst.com.
