
 Yahoo Finance
 Here’s What Goodwin plc’s (LON:GDWN) P/E Is Telling Us

This article is written for those who want to get better at using price to earnings ratios (P/E ratios). To keep it practical, we’ll show how Goodwin plc’s (LON:GDWN) P/E ratio could help you assess the value on offer. Goodwin has a P/E ratio of 22.61, based on the last twelve months. That is equivalent to an earnings yield of about 4.4%.
View our latest analysis for Goodwin
How Do You Calculate A P/E Ratio?
The formula for P/E is:
Price to Earnings Ratio = Price per Share ÷ Earnings per Share (EPS)
Or for Goodwin:
P/E of 22.61 = £26.7 ÷ £1.18 (Based on the year to April 2018.)
Is A High Price-to-Earnings Ratio Good?
A higher P/E ratio means that buyers have to pay a higher price for each £1 the company has earned over the last year. That isn’t a good or a bad thing on its own, but a high P/E means that buyers have a higher opinion of the business’s prospects, relative to stocks with a lower P/E.
How Growth Rates Impact P/E Ratios
When earnings fall, the ‘E’ decreases, over time. That means even if the current P/E is low, it will increase over time if the share price stays flat. Then, a higher P/E might scare off shareholders, pushing the share price down.
It’s nice to see that Goodwin grew EPS by a stonking 40% in the last year. In contrast, EPS has decreased by 24%, annually, over 5 years.
How Does Goodwin’s P/E Ratio Compare To Its Peers?
We can get an indication of market expectations by looking at the P/E ratio. You can see in the image below that the average P/E (19.2) for companies in the machinery industry is lower than Goodwin’s P/E.
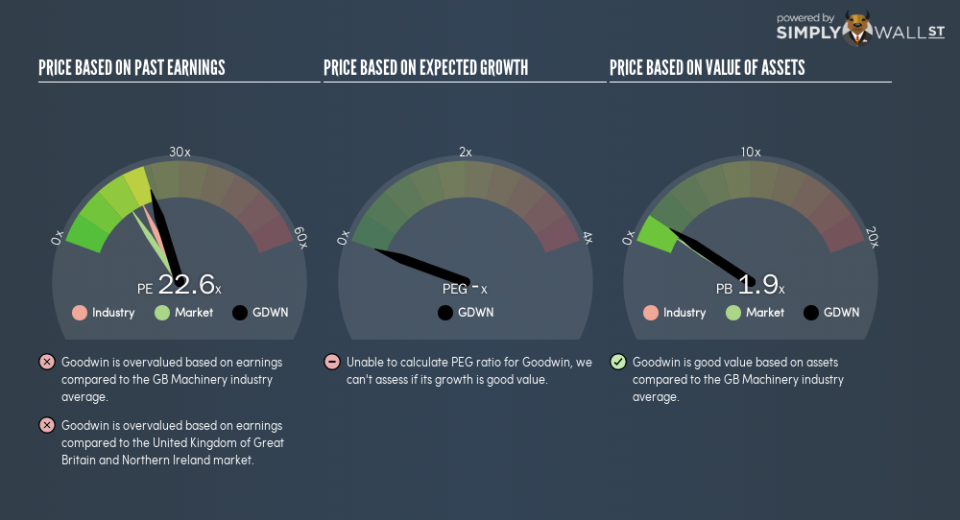
Its relatively high P/E ratio indicates that Goodwin shareholders think it will perform better than other companies in its industry classification. Shareholders are clearly optimistic, but the future is always uncertain. So further research is always essential. I often monitor director buying and selling.
Don’t Forget: The P/E Does Not Account For Debt or Bank Deposits
It’s important to note that the P/E ratio considers the market capitalization, not the enterprise value. In other words, it does not consider any debt or cash that the company may have on the balance sheet. In theory, a company can lower its future P/E ratio by using cash or debt to invest in growth.
Such expenditure might be good or bad, in the long term, but the point here is that the balance sheet is not reflected by this ratio.
Is Debt Impacting Goodwin’s P/E?
Goodwin’s net debt is 5.6% of its market cap. It would probably trade on a higher P/E ratio if it had a lot of cash, but I doubt it is having a big impact.
The Bottom Line On Goodwin’s P/E Ratio
Goodwin has a P/E of 22.6. That’s higher than the average in the GB market, which is 15.6. The company is not overly constrained by its modest debt levels, and it is growing earnings per share. So it is not surprising the market is probably extrapolating recent growth well into the future, reflected in the relatively high P/E ratio.
Investors should be looking to buy stocks that the market is wrong about. As value investor Benjamin Graham famously said, ‘In the short run, the market is a voting machine but in the long run, it is a weighing machine.’ We don’t have analyst forecasts, but you might want to assess this data-rich visualization of earnings, revenue and cash flow.
But note: Goodwin may not be the best stock to buy. So take a peek at this free list of interesting companies with strong recent earnings growth (and a P/E ratio below 20).
To help readers see past the short term volatility of the financial market, we aim to bring you a long-term focused research analysis purely driven by fundamental data. Note that our analysis does not factor in the latest price-sensitive company announcements.
The author is an independent contributor and at the time of publication had no position in the stocks mentioned. For errors that warrant correction please contact the editor at editorial-team@simplywallst.com.
