
 Yahoo Finance
 Here’s What Goodwin PLC’s (LON:GDWN) Return On Capital Can Tell Us

Today we'll look at Goodwin PLC (LON:GDWN) and reflect on its potential as an investment. Specifically, we'll consider its Return On Capital Employed (ROCE), since that will give us an insight into how efficiently the business can generate profits from the capital it requires.
First, we'll go over how we calculate ROCE. Next, we'll compare it to others in its industry. And finally, we'll look at how its current liabilities are impacting its ROCE.
Understanding Return On Capital Employed (ROCE)
ROCE measures the 'return' (pre-tax profit) a company generates from capital employed in its business. In general, businesses with a higher ROCE are usually better quality. In brief, it is a useful tool, but it is not without drawbacks. Author Edwin Whiting says to be careful when comparing the ROCE of different businesses, since 'No two businesses are exactly alike.
So, How Do We Calculate ROCE?
The formula for calculating the return on capital employed is:
Return on Capital Employed = Earnings Before Interest and Tax (EBIT) ÷ (Total Assets - Current Liabilities)
Or for Goodwin:
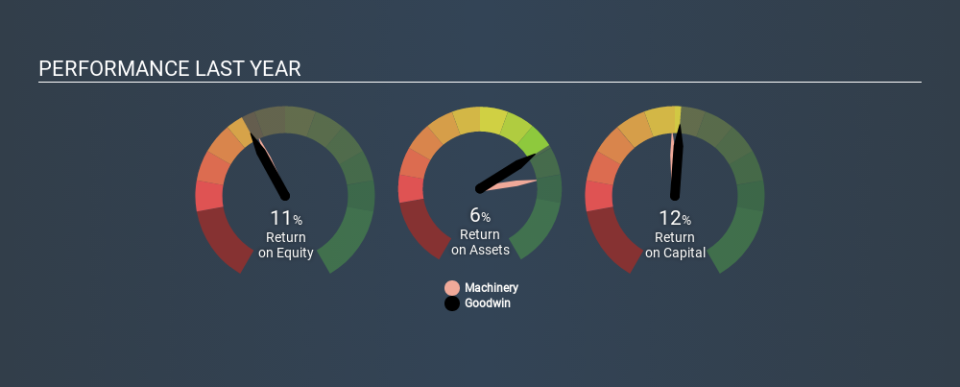
0.12 = UK£16m ÷ (UK£189m - UK£58m) (Based on the trailing twelve months to April 2019.)
So, Goodwin has an ROCE of 12%.
See our latest analysis for Goodwin
Is Goodwin's ROCE Good?
When making comparisons between similar businesses, investors may find ROCE useful. We can see Goodwin's ROCE is around the 12% average reported by the Machinery industry. Separate from Goodwin's performance relative to its industry, its ROCE in absolute terms looks satisfactory, and it may be worth researching in more depth.
You can click on the image below to see (in greater detail) how Goodwin's past growth compares to other companies.
When considering this metric, keep in mind that it is backwards looking, and not necessarily predictive. ROCE can be deceptive for cyclical businesses, as returns can look incredible in boom times, and terribly low in downturns. ROCE is only a point-in-time measure. You can check if Goodwin has cyclical profits by looking at this free graph of past earnings, revenue and cash flow.
Goodwin's Current Liabilities And Their Impact On Its ROCE
Liabilities, such as supplier bills and bank overdrafts, are referred to as current liabilities if they need to be paid within 12 months. The ROCE equation subtracts current liabilities from capital employed, so a company with a lot of current liabilities appears to have less capital employed, and a higher ROCE than otherwise. To counter this, investors can check if a company has high current liabilities relative to total assets.
Goodwin has total liabilities of UK£58m and total assets of UK£189m. As a result, its current liabilities are equal to approximately 31% of its total assets. Goodwin has a medium level of current liabilities, which would boost the ROCE.
What We Can Learn From Goodwin's ROCE
While its ROCE looks good, it's worth remembering that the current liabilities are making the business look better. Goodwin shapes up well under this analysis, but it is far from the only business delivering excellent numbers . You might also want to check this free collection of companies delivering excellent earnings growth.
If you like to buy stocks alongside management, then you might just love this free list of companies. (Hint: insiders have been buying them).
If you spot an error that warrants correction, please contact the editor at editorial-team@simplywallst.com. This article by Simply Wall St is general in nature. It does not constitute a recommendation to buy or sell any stock, and does not take account of your objectives, or your financial situation. Simply Wall St has no position in the stocks mentioned.
We aim to bring you long-term focused research analysis driven by fundamental data. Note that our analysis may not factor in the latest price-sensitive company announcements or qualitative material. Thank you for reading.
