
 Yahoo Finance
 Graco (GGG) Misses Q3 Earnings Estimates, Lowers '19 View
Graco Inc. GGG delivered weak results for the third quarter of 2019. Its earnings and sales lagged estimates by 11.76% and 4.9%, respectively. This was the third consecutive quarter of weak results.
Adjusted earnings in the quarter under review were 45 cents per share, lagging the Zacks Consensus Estimate of 51 cents. The company’s quarterly earnings declined 10% year over year due to weakness in the Asia Pacific, forex woes and low margins. However, lower tax expenses and roughly 0.7% fall in share count were a relief.
Revenues Decline on Weak Asia Pacific Performance
In the reported quarter, Graco’s net sales were $400.6 million, suggesting a 3.7% decline from the year-ago quarter. Weak volume and price, and forex woes adversely impacted results by 3% and 2%, respectively. However, acquisitions boosted sales by 1%.
The company’s net sales lagged the Zacks Consensus Estimate of $421.3 million.
On a geographical basis, quarterly sales generated from the Americas grew 3%. Sales in EMEA were flat year over year (or grew 4% at a constant-currency rate) while sales from the Asia Pacific declined 26% (or were down 24% at a constant-currency rate).
The company reports revenues under three segments. A brief discussion of the quarterly results is provided below:
The Industrial segment’s revenues totaled $175 million, representing 43.7% of net revenues in the quarter under review. On a year-over-year basis, the segment’s revenues declined 10.6% mainly due to 2% adverse impact of unfavorable movements in foreign currencies, and 9% negative impact of volume and price.
The Process segment’s sales of $84.1 million were down 0.6% from the year-ago quarter. It accounted for roughly 21% of net revenues in the reported quarter. Volume and price had adverse impact of 2% in the quarter, while forex woes had 1% negative impact. However, acquisitions contributed 2% to sales growth.
The Contractor segment generated revenues of $141.4 million, accounting for roughly 35.3% of net revenues in the reported quarter. Sales grew 4.4% year over year on positive impacts of 5% from volume and price, offset by forex woes of 1%.
Margins Decline Y/Y
In the reported quarter, Graco’s cost of sales dipped 0.7% year over year to $193.2 million. It represented 48.2% of the quarter’s net sales versus 46.8% in the year-ago quarter. Gross profit declined 6.4% year over year to $207.4 million while margin was down by 140 basis points (bps) to 51.8%. The fall in margin was triggered by unfavorable product and channel mix, forex woes, and adverse factory volume. As noted, high costs of raw materials were offset by favorable pricing.
Operating expenses (including product development; selling, marketing and distribution; and general and administrative expenses) declined 2.5% year over year to roughly $104 million. It represented 26% of net sales in the reported quarter versus 25.7% in the year-ago quarter.
Operating profit dipped 9.9% year over year to $103.4 million, with a year-over-year decline of 180 bps in the margin to 25.8%. Interest expenses in the reported quarter rose 1% year over year to $3.6 million. Adjusted tax rate in the quarter was 20%, down from 20.6% in the year-ago quarter.
Balance Sheet & Cash Flow
Exiting the third quarter, Graco had cash and cash equivalents of $177.3 million, down 2% from $180.9 million recorded in the last reported quarter. Long-term debt was up 7.3% sequentially to $192.1 million.
In the first three quarters of 2019, the company generated net cash of $299.5 million from operating activities, roughly 17.8% above the year-ago period. Capital spent on the addition of property, plant and equipment totaled $102.5 million versus $39.6 million in the year-ago period.
The company distributed dividends worth $79.8 million and repurchased shares for $5.1 million in the first nine months of 2019. During the third quarter, it repurchased 60 thousand shares.
Outlook
Graco continues to work on growth strategies, while believes that challenging macro conditions will influence its results in 2019. Organic sales (at a constant-currency rate) are predicted to be flat, down from expectation of low-single-digit growth. The company believes that Process and Industrial segments’ performances in the Americas will slow down while the Asia Pacific will witness a sharp decline.
Organic sales (at constant-currency rates) are predicted to be flat to grow in a low-single digit, down from previously mentioned mid-single-digit growth for the Americas. For EMEA, organic sales will likely grow in a mid-single digit (view unchanged). Organic sales for the Asia Pacific are expected to decline in double-digits as compared with previously mentioned low-single-digit decline.
The company predicts capital expenditure (excluding mortar and brick) of $35 million for 2019, down from $40 million mentioned earlier. Also, spending on building projects to boost distribution and production capacity will likely be $100-$105 million versus $110-$115 million stated previously.
Corporate expenses (unallocated) are estimated to be $30 million versus $31 million mentioned earlier. Also, forex woes are predicted to adversely influence sales by 2% (1.5% stated earlier) and earnings by 4% (3% mentioned previously). Effective tax rate is predicted to be 20-21% for the year and the fourth quarter.
The company expects unfavorable factory volume to affect fourth-quarter gross margin to the tune of 75-80 bps.
Graco Inc. Price, Consensus and EPS Surprise
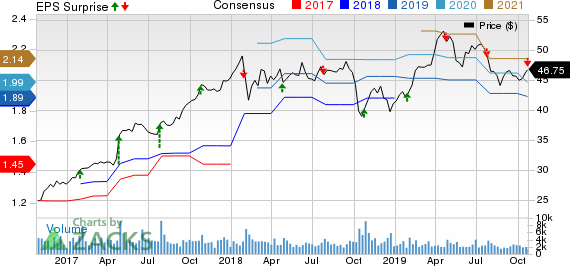
Graco Inc. price-consensus-eps-surprise-chart | Graco Inc. Quote
Zacks Rank & Stocks to Consider
With a market capitalization of roughly $7.8 billion, Graco currently carries a Zacks Rank #4 (Sell).
Some better-ranked stocks in the Zacks Industrial Products sector are Cintas Corporation CTAS, Brady Corporation BRC and Dover Corporation DOV. All these stocks currently carry a Zacks Rank #2 (Buy). You can see the complete list of today’s Zacks #1 Rank (Strong Buy) stocks here.
In the past 60 days, earnings estimates for these companies have improved for the current year. Further, average earnings surprise for the last four quarters was 6.26% for Cintas, 9.68% for Brady and 6.70% for Dover.
Today's Best Stocks from Zacks
Would you like to see the updated picks from our best market-beating strategies? From 2017 through 2018, while the S&P 500 gained +15.8%, five of our screens returned +38.0%, +61.3%, +61.6%, +68.1%, and +98.3%.
This outperformance has not just been a recent phenomenon. From 2000 – 2018, while the S&P averaged +4.8% per year, our top strategies averaged up to +56.2% per year.
See their latest picks free >>
Want the latest recommendations from Zacks Investment Research? Today, you can download 7 Best Stocks for the Next 30 Days. Click to get this free report
Cintas Corporation (CTAS) : Free Stock Analysis Report
Graco Inc. (GGG) : Free Stock Analysis Report
Dover Corporation (DOV) : Free Stock Analysis Report
Brady Corporation (BRC) : Free Stock Analysis Report
To read this article on Zacks.com click here.
Zacks Investment Research
