
 Yahoo Finance
 What Is GrafTech International's (NYSE:EAF) P/E Ratio After Its Share Price Tanked?

Unfortunately for some shareholders, the GrafTech International (NYSE:EAF) share price has dived 30% in the last thirty days. That drop has capped off a tough year for shareholders, with the share price down 45% in that time.
Assuming nothing else has changed, a lower share price makes a stock more attractive to potential buyers. While the market sentiment towards a stock is very changeable, in the long run, the share price will tend to move in the same direction as earnings per share. The implication here is that long term investors have an opportunity when expectations of a company are too low. Perhaps the simplest way to get a read on investors' expectations of a business is to look at its Price to Earnings Ratio (PE Ratio). A high P/E implies that investors have high expectations of what a company can achieve compared to a company with a low P/E ratio.
View our latest analysis for GrafTech International
How Does GrafTech International's P/E Ratio Compare To Its Peers?
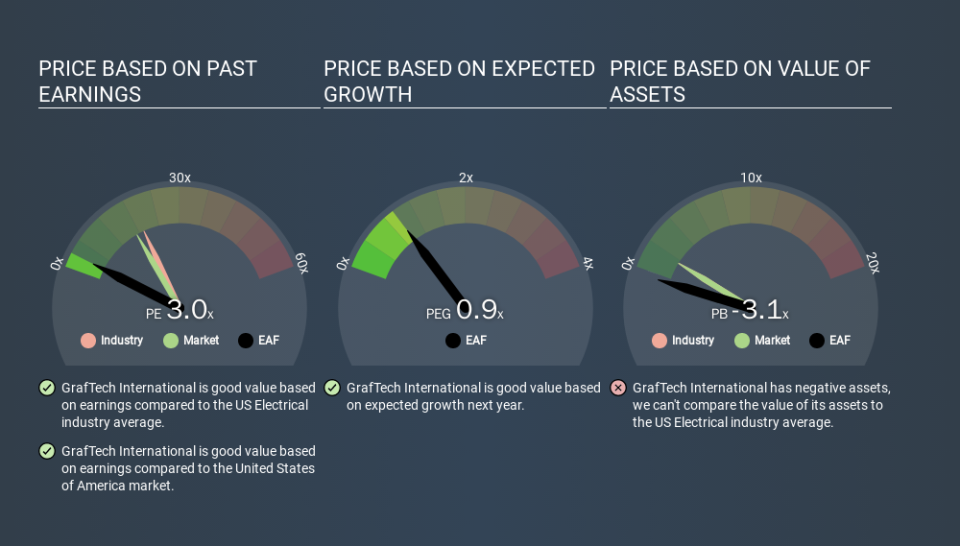
We can tell from its P/E ratio of 3.03 that sentiment around GrafTech International isn't particularly high. If you look at the image below, you can see GrafTech International has a lower P/E than the average (18.6) in the electrical industry classification.
Its relatively low P/E ratio indicates that GrafTech International shareholders think it will struggle to do as well as other companies in its industry classification. While current expectations are low, the stock could be undervalued if the situation is better than the market assumes. You should delve deeper. I like to check if company insiders have been buying or selling.
How Growth Rates Impact P/E Ratios
P/E ratios primarily reflect market expectations around earnings growth rates. When earnings grow, the 'E' increases, over time. That means unless the share price increases, the P/E will reduce in a few years. And as that P/E ratio drops, the company will look cheap, unless its share price increases.
GrafTech International shrunk earnings per share by 10% over the last year.
Remember: P/E Ratios Don't Consider The Balance Sheet
Don't forget that the P/E ratio considers market capitalization. That means it doesn't take debt or cash into account. The exact same company would hypothetically deserve a higher P/E ratio if it had a strong balance sheet, than if it had a weak one with lots of debt, because a cashed up company can spend on growth.
Such spending might be good or bad, overall, but the key point here is that you need to look at debt to understand the P/E ratio in context.
Is Debt Impacting GrafTech International's P/E?
GrafTech International's net debt is 83% of its market cap. If you want to compare its P/E ratio to other companies, you should absolutely keep in mind it has significant borrowings.
The Bottom Line On GrafTech International's P/E Ratio
GrafTech International trades on a P/E ratio of 3.0, which is below the US market average of 16.9. When you consider that the company has significant debt, and didn't grow EPS last year, it isn't surprising that the market has muted expectations. What can be absolutely certain is that the market has become more pessimistic about GrafTech International over the last month, with the P/E ratio falling from 4.3 back then to 3.0 today. For those who prefer to invest with the flow of momentum, that might be a bad sign, but for deep value investors this stock might justify some research.
When the market is wrong about a stock, it gives savvy investors an opportunity. If it is underestimating a company, investors can make money by buying and holding the shares until the market corrects itself. So this free report on the analyst consensus forecasts could help you make a master move on this stock.
Of course, you might find a fantastic investment by looking at a few good candidates. So take a peek at this free list of companies with modest (or no) debt, trading on a P/E below 20.
If you spot an error that warrants correction, please contact the editor at editorial-team@simplywallst.com. This article by Simply Wall St is general in nature. It does not constitute a recommendation to buy or sell any stock, and does not take account of your objectives, or your financial situation. Simply Wall St has no position in the stocks mentioned.
We aim to bring you long-term focused research analysis driven by fundamental data. Note that our analysis may not factor in the latest price-sensitive company announcements or qualitative material. Thank you for reading.
