
 Yahoo Finance
 Is Grafton Group plc's (LON:GFTU) Recent Stock Performance Tethered To Its Strong Fundamentals?
Grafton Group's (LON:GFTU) stock is up by a considerable 5.8% over the past month. Given that the market rewards strong financials in the long-term, we wonder if that is the case in this instance. In this article, we decided to focus on Grafton Group's ROE.
ROE or return on equity is a useful tool to assess how effectively a company can generate returns on the investment it received from its shareholders. In other words, it is a profitability ratio which measures the rate of return on the capital provided by the company's shareholders.
Check out our latest analysis for Grafton Group
How Do You Calculate Return On Equity?
The formula for ROE is:
Return on Equity = Net Profit (from continuing operations) ÷ Shareholders' Equity
So, based on the above formula, the ROE for Grafton Group is:
12% = UK£207m ÷ UK£1.7b (Based on the trailing twelve months to December 2021).
The 'return' is the income the business earned over the last year. So, this means that for every £1 of its shareholder's investments, the company generates a profit of £0.12.
What Is The Relationship Between ROE And Earnings Growth?
Thus far, we have learned that ROE measures how efficiently a company is generating its profits. Based on how much of its profits the company chooses to reinvest or "retain", we are then able to evaluate a company's future ability to generate profits. Assuming everything else remains unchanged, the higher the ROE and profit retention, the higher the growth rate of a company compared to companies that don't necessarily bear these characteristics.
A Side By Side comparison of Grafton Group's Earnings Growth And 12% ROE
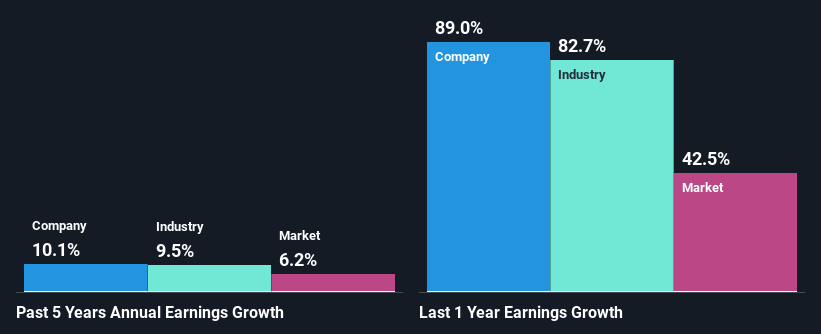
To start with, Grafton Group's ROE looks acceptable. Further, the company's ROE is similar to the industry average of 14%. Consequently, this likely laid the ground for the decent growth of 10% seen over the past five years by Grafton Group.
We then performed a comparison between Grafton Group's net income growth with the industry, which revealed that the company's growth is similar to the average industry growth of 9.5% in the same period.
The basis for attaching value to a company is, to a great extent, tied to its earnings growth. What investors need to determine next is if the expected earnings growth, or the lack of it, is already built into the share price. Doing so will help them establish if the stock's future looks promising or ominous. Is GFTU fairly valued? This infographic on the company's intrinsic value has everything you need to know.
Is Grafton Group Making Efficient Use Of Its Profits?
Grafton Group has a healthy combination of a moderate three-year median payout ratio of 31% (or a retention ratio of 69%) and a respectable amount of growth in earnings as we saw above, meaning that the company has been making efficient use of its profits.
Besides, Grafton Group has been paying dividends for at least ten years or more. This shows that the company is committed to sharing profits with its shareholders. Upon studying the latest analysts' consensus data, we found that the company's future payout ratio is expected to rise to 39% over the next three years. However, the company's ROE is not expected to change by much despite the higher expected payout ratio.
Summary
Overall, we are quite pleased with Grafton Group's performance. In particular, it's great to see that the company is investing heavily into its business and along with a high rate of return, that has resulted in a sizeable growth in its earnings. With that said, on studying the latest analyst forecasts, we found that while the company has seen growth in its past earnings, analysts expect its future earnings to shrink. Are these analysts expectations based on the broad expectations for the industry, or on the company's fundamentals? Click here to be taken to our analyst's forecasts page for the company.
Have feedback on this article? Concerned about the content? Get in touch with us directly. Alternatively, email editorial-team (at) simplywallst.com.
This article by Simply Wall St is general in nature. We provide commentary based on historical data and analyst forecasts only using an unbiased methodology and our articles are not intended to be financial advice. It does not constitute a recommendation to buy or sell any stock, and does not take account of your objectives, or your financial situation. We aim to bring you long-term focused analysis driven by fundamental data. Note that our analysis may not factor in the latest price-sensitive company announcements or qualitative material. Simply Wall St has no position in any stocks mentioned.
