
 Yahoo Finance
 The Grainger (LON:GRI) Share Price Is Up 32% And Shareholders Are Holding On

Generally speaking the aim of active stock picking is to find companies that provide returns that are superior to the market average. Buying under-rated businesses is one path to excess returns. For example, the Grainger plc (LON:GRI) share price is up 32% in the last 5 years, clearly besting the market return of around 5.1% (ignoring dividends).
View our latest analysis for Grainger
There is no denying that markets are sometimes efficient, but prices do not always reflect underlying business performance. One way to examine how market sentiment has changed over time is to look at the interaction between a company's share price and its earnings per share (EPS).
During five years of share price growth, Grainger actually saw its EPS drop 1.7% per year. So it's hard to argue that the earnings per share are the best metric to judge the company, as it may not be optimized for profits at this point. Therefore, it's worth taking a look at other metrics to try to understand the share price movements.
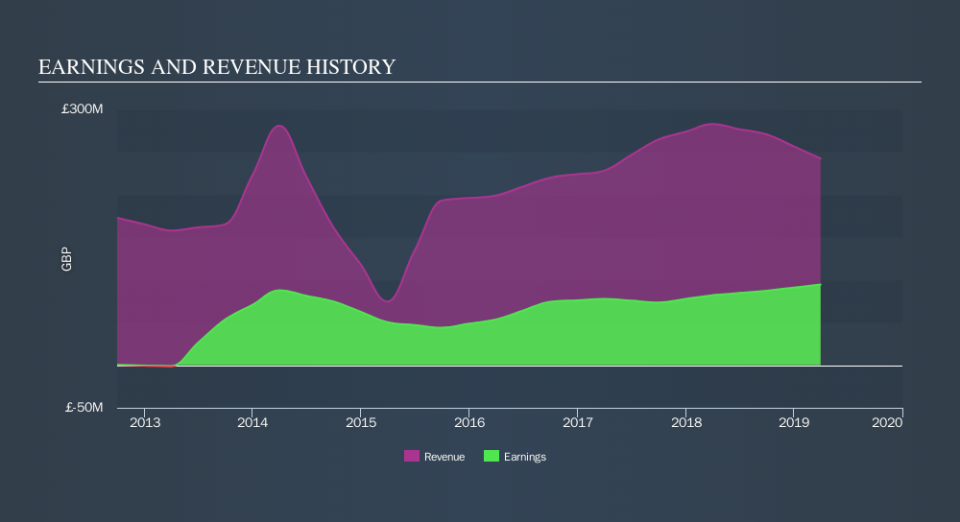
On the other hand, Grainger's revenue is growing nicely, at a compound rate of 10% over the last five years. In that case, the company may be sacrificing current earnings per share to drive growth.
The graphic below depicts how earnings and revenue have changed over time (unveil the exact values by clicking on the image).
It's probably worth noting that the CEO is paid less than the median at similar sized companies. It's always worth keeping an eye on CEO pay, but a more important question is whether the company will grow earnings throughout the years. So we recommend checking out this free report showing consensus forecasts
What About Dividends?
When looking at investment returns, it is important to consider the difference between total shareholder return (TSR) and share price return. The TSR is a return calculation that accounts for the value of cash dividends (assuming that any dividend received was reinvested) and the calculated value of any discounted capital raisings and spin-offs. So for companies that pay a generous dividend, the TSR is often a lot higher than the share price return. In the case of Grainger, it has a TSR of 58% for the last 5 years. That exceeds its share price return that we previously mentioned. This is largely a result of its dividend payments!
A Different Perspective
Grainger shareholders are down 7.6% for the year (even including dividends) , but the market itself is up 3.9%. Even the share prices of good stocks drop sometimes, but we want to see improvements in the fundamental metrics of a business, before getting too interested. Longer term investors wouldn't be so upset, since they would have made 9.6%, each year, over five years. If the fundamental data continues to indicate long term sustainable growth, the current sell-off could be an opportunity worth considering. Most investors take the time to check the data on insider transactions. You can click here to see if insiders have been buying or selling.
If you would prefer to check out another company -- one with potentially superior financials -- then do not miss this free list of companies that have proven they can grow earnings.
Please note, the market returns quoted in this article reflect the market weighted average returns of stocks that currently trade on GB exchanges.
We aim to bring you long-term focused research analysis driven by fundamental data. Note that our analysis may not factor in the latest price-sensitive company announcements or qualitative material.
If you spot an error that warrants correction, please contact the editor at editorial-team@simplywallst.com. This article by Simply Wall St is general in nature. It does not constitute a recommendation to buy or sell any stock, and does not take account of your objectives, or your financial situation. Simply Wall St has no position in the stocks mentioned. Thank you for reading.
