
 Yahoo Finance
 Is Grainger plc’s (LON:GRI) Balance Sheet Strong Enough To Weather A Storm?

Investors are always looking for growth in small-cap stocks like Grainger plc (LON:GRI), with a market cap of UK£1.29b. However, an important fact which most ignore is: how financially healthy is the business? So, understanding the company’s financial health becomes crucial, since poor capital management may bring about bankruptcies, which occur at a higher rate for small-caps. Here are few basic financial health checks you should consider before taking the plunge. Nevertheless, since I only look at basic financial figures, I’d encourage you to dig deeper yourself into GRI here.
How does GRI’s operating cash flow stack up against its debt?
GRI has built up its total debt levels in the last twelve months, from UK£856.80m to UK£0 – this includes both the current and long-term debt. With this increase in debt, GRI’s cash and short-term investments stands at UK£92.30m , ready to deploy into the business. On top of this, GRI has generated UK£45.50m in operating cash flow in the last twelve months, leading to an operating cash to total debt ratio of 4.89%, signalling that GRI’s current level of operating cash is not high enough to cover debt. This ratio can also be interpreted as a measure of efficiency as an alternative to return on assets. In GRI’s case, it is able to generate 0.049x cash from its debt capital.
Does GRI’s liquid assets cover its short-term commitments?
At the current liabilities level of UK£63.00m liabilities, the company has maintained a safe level of current assets to meet its obligations, with the current ratio last standing at 17.13x. However, a ratio greater than 3x may be considered as too high, as GRI could be holding too much capital in a low-return investment environment.
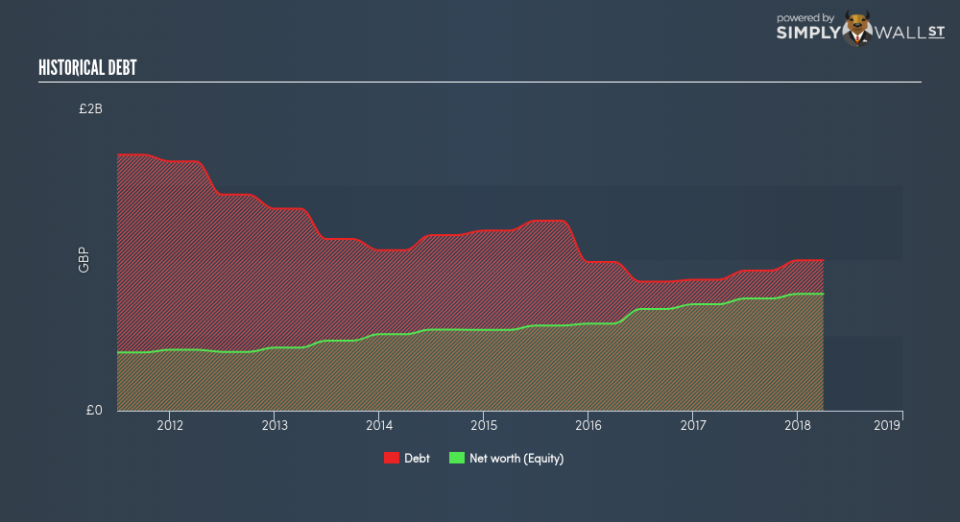
Is GRI’s debt level acceptable?
With total debt exceeding equities, GRI is considered a highly levered company. This is not uncommon for a small-cap company given that debt tends to be lower-cost and at times, more accessible. We can test if GRI’s debt levels are sustainable by measuring interest payments against earnings of a company. Ideally, earnings before interest and tax (EBIT) should cover net interest by at least three times. For GRI, the ratio of 5.14x suggests that interest is appropriately covered, which means that lenders may be less hesitant to lend out more funding as GRI’s high interest coverage is seen as responsible and safe practice.
Next Steps:
GRI’s cash flow coverage indicates it could improve its operating efficiency in order to meet demand for debt repayments should unforeseen events arise. Though, the company exhibits proper management of current assets and upcoming liabilities. This is only a rough assessment of financial health, and I’m sure GRI has company-specific issues impacting its capital structure decisions. I recommend you continue to research Grainger to get a more holistic view of the stock by looking at:
Future Outlook: What are well-informed industry analysts predicting for GRI’s future growth? Take a look at our free research report of analyst consensus for GRI’s outlook.
Valuation: What is GRI worth today? Is the stock undervalued, even when its growth outlook is factored into its intrinsic value? The intrinsic value infographic in our free research report helps visualize whether GRI is currently mispriced by the market.
Other High-Performing Stocks: Are there other stocks that provide better prospects with proven track records? Explore our free list of these great stocks here.
To help readers see pass the short term volatility of the financial market, we aim to bring you a long-term focused research analysis purely driven by fundamental data. Note that our analysis does not factor in the latest price sensitive company announcements.
The author is an independent contributor and at the time of publication had no position in the stocks mentioned.
