
 Yahoo Finance
 Is Grainger plc's (LON:GRI) Balance Sheet A Threat To Its Future?

While small-cap stocks, such as Grainger plc (LON:GRI) with its market cap of UK£1.6b, are popular for their explosive growth, investors should also be aware of their balance sheet to judge whether the company can survive a downturn. Evaluating financial health as part of your investment thesis is essential, since poor capital management may bring about bankruptcies, which occur at a higher rate for small-caps. We'll look at some basic checks that can form a snapshot the company’s financial strength. However, these checks don't give you a full picture, so I suggest you dig deeper yourself into GRI here.
Want to participate in a short research study? Help shape the future of investing tools and you could win a $250 gift card!
GRI’s Debt (And Cash Flows)
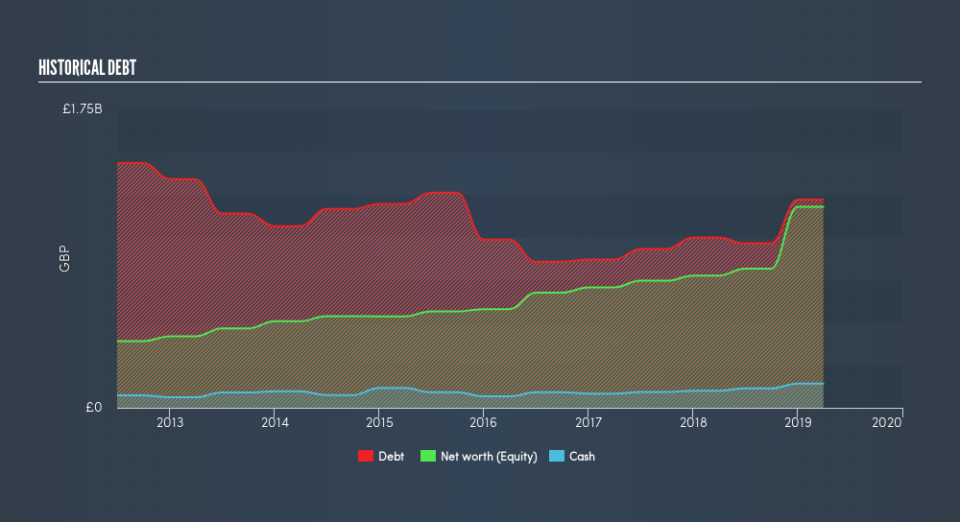
GRI has built up its total debt levels in the last twelve months, from UK£998m to UK£1.2b , which includes long-term debt. With this increase in debt, GRI's cash and short-term investments stands at UK£142m to keep the business going. Moreover, GRI has produced cash from operations of UK£164m in the last twelve months, leading to an operating cash to total debt ratio of 13%, signalling that GRI’s operating cash is less than its debt.
Can GRI pay its short-term liabilities?
Looking at GRI’s UK£90m in current liabilities, the company has been able to meet these obligations given the level of current assets of UK£932m, with a current ratio of 10.35x. The current ratio is calculated by dividing current assets by current liabilities. However, a ratio above 3x may be considered excessive by some investors, yet this is not usually a major negative for a company.
Is GRI’s debt level acceptable?
GRI is a highly-leveraged company with debt exceeding equity by over 100%. This is a bit unusual for a small-cap stock, since they generally have a harder time borrowing than large more established companies. We can check to see whether GRI is able to meet its debt obligations by looking at the net interest coverage ratio. A company generating earnings before interest and tax (EBIT) at least three times its net interest payments is considered financially sound. In GRI's, case, the ratio of 5.44x suggests that interest is appropriately covered, which means that debtors may be willing to loan the company more money, giving GRI ample headroom to grow its debt facilities.
Next Steps:
GRI’s high cash coverage means that, although its debt levels are high, the company is able to utilise its borrowings efficiently in order to generate cash flow. Since there is also no concerns around GRI's liquidity needs, this may be its optimal capital structure for the time being. Keep in mind I haven't considered other factors such as how GRI has been performing in the past. You should continue to research Grainger to get a more holistic view of the small-cap by looking at:
Future Outlook: What are well-informed industry analysts predicting for GRI’s future growth? Take a look at our free research report of analyst consensus for GRI’s outlook.
Historical Performance: What has GRI's returns been like over the past? Go into more detail in the past track record analysis and take a look at the free visual representations of our analysis for more clarity.
Other High-Performing Stocks: Are there other stocks that provide better prospects with proven track records? Explore our free list of these great stocks here.
We aim to bring you long-term focused research analysis driven by fundamental data. Note that our analysis may not factor in the latest price-sensitive company announcements or qualitative material.
If you spot an error that warrants correction, please contact the editor at editorial-team@simplywallst.com. This article by Simply Wall St is general in nature. It does not constitute a recommendation to buy or sell any stock, and does not take account of your objectives, or your financial situation. Simply Wall St has no position in the stocks mentioned. Thank you for reading.
