
 Yahoo Finance
 Gravity (NASDAQ:GRVY) Is Achieving High Returns On Its Capital
There are a few key trends to look for if we want to identify the next multi-bagger. Firstly, we'll want to see a proven return on capital employed (ROCE) that is increasing, and secondly, an expanding base of capital employed. Basically this means that a company has profitable initiatives that it can continue to reinvest in, which is a trait of a compounding machine. With that in mind, the ROCE of Gravity (NASDAQ:GRVY) looks great, so lets see what the trend can tell us.
Understanding Return On Capital Employed (ROCE)
For those who don't know, ROCE is a measure of a company's yearly pre-tax profit (its return), relative to the capital employed in the business. The formula for this calculation on Gravity is:
Return on Capital Employed = Earnings Before Interest and Tax (EBIT) ÷ (Total Assets - Current Liabilities)
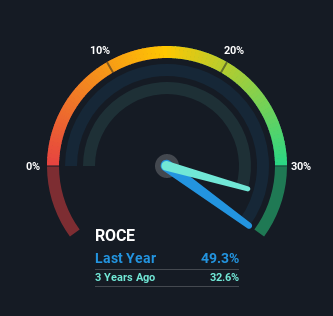
0.49 = ₩110b ÷ (₩286b - ₩63b) (Based on the trailing twelve months to June 2021).
Therefore, Gravity has an ROCE of 49%. In absolute terms that's a great return and it's even better than the Entertainment industry average of 8.2%.
Check out our latest analysis for Gravity
While the past is not representative of the future, it can be helpful to know how a company has performed historically, which is why we have this chart above. If you're interested in investigating Gravity's past further, check out this free graph of past earnings, revenue and cash flow.
So How Is Gravity's ROCE Trending?
Gravity has recently broken into profitability so their prior investments seem to be paying off. About five years ago the company was generating losses but things have turned around because it's now earning 49% on its capital. Not only that, but the company is utilizing 602% more capital than before, but that's to be expected from a company trying to break into profitability. This can tell us that the company has plenty of reinvestment opportunities that are able to generate higher returns.
In another part of our analysis, we noticed that the company's ratio of current liabilities to total assets decreased to 22%, which broadly means the business is relying less on its suppliers or short-term creditors to fund its operations. Therefore we can rest assured that the growth in ROCE is a result of the business' fundamental improvements, rather than a cooking class featuring this company's books.
The Bottom Line On Gravity's ROCE
To the delight of most shareholders, Gravity has now broken into profitability. And with the stock having performed exceptionally well over the last five years, these patterns are being accounted for by investors. Therefore, we think it would be worth your time to check if these trends are going to continue.
If you want to continue researching Gravity, you might be interested to know about the 1 warning sign that our analysis has discovered.
Gravity is not the only stock earning high returns. If you'd like to see more, check out our free list of companies earning high returns on equity with solid fundamentals.
This article by Simply Wall St is general in nature. We provide commentary based on historical data and analyst forecasts only using an unbiased methodology and our articles are not intended to be financial advice. It does not constitute a recommendation to buy or sell any stock, and does not take account of your objectives, or your financial situation. We aim to bring you long-term focused analysis driven by fundamental data. Note that our analysis may not factor in the latest price-sensitive company announcements or qualitative material. Simply Wall St has no position in any stocks mentioned.
Have feedback on this article? Concerned about the content? Get in touch with us directly. Alternatively, email editorial-team (at) simplywallst.com.
