
 Yahoo Finance
 Green Cross Health (NZSE:GXH) shareholders notch a 18% CAGR over 3 years, yet earnings have been shrinking
One simple way to benefit from the stock market is to buy an index fund. But if you pick the right individual stocks, you could make more than that. Just take a look at Green Cross Health Limited (NZSE:GXH), which is up 14%, over three years, soundly beating the market decline of 20% (not including dividends). On the other hand, the returns haven't been quite so good recently, with shareholders up just 16% , including dividends .
Since it's been a strong week for Green Cross Health shareholders, let's have a look at trend of the longer term fundamentals.
View our latest analysis for Green Cross Health
There is no denying that markets are sometimes efficient, but prices do not always reflect underlying business performance. One flawed but reasonable way to assess how sentiment around a company has changed is to compare the earnings per share (EPS) with the share price.
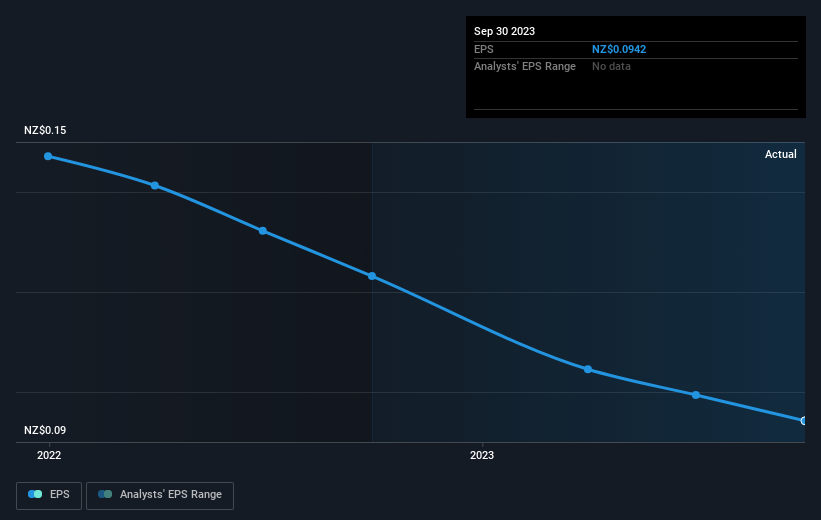
Over the last three years, Green Cross Health failed to grow earnings per share, which fell 4.2% (annualized).
While EPS is down but the share price is moving up, neither move is particularly drastic, suggesting the market was previously too pessimistic. Still, if EPS declines indefinitely, the share price will likely follow (especially if the company makes a loss).
The graphic below depicts how EPS has changed over time (unveil the exact values by clicking on the image).
Dive deeper into Green Cross Health's key metrics by checking this interactive graph of Green Cross Health's earnings, revenue and cash flow.
What About Dividends?
When looking at investment returns, it is important to consider the difference between total shareholder return (TSR) and share price return. Whereas the share price return only reflects the change in the share price, the TSR includes the value of dividends (assuming they were reinvested) and the benefit of any discounted capital raising or spin-off. So for companies that pay a generous dividend, the TSR is often a lot higher than the share price return. We note that for Green Cross Health the TSR over the last 3 years was 65%, which is better than the share price return mentioned above. The dividends paid by the company have thusly boosted the total shareholder return.
A Different Perspective
It's good to see that Green Cross Health has rewarded shareholders with a total shareholder return of 16% in the last twelve months. That's including the dividend. Since the one-year TSR is better than the five-year TSR (the latter coming in at 11% per year), it would seem that the stock's performance has improved in recent times. Someone with an optimistic perspective could view the recent improvement in TSR as indicating that the business itself is getting better with time. It's always interesting to track share price performance over the longer term. But to understand Green Cross Health better, we need to consider many other factors. Even so, be aware that Green Cross Health is showing 2 warning signs in our investment analysis , you should know about...
Of course Green Cross Health may not be the best stock to buy. So you may wish to see this free collection of growth stocks.
Please note, the market returns quoted in this article reflect the market weighted average returns of stocks that currently trade on New Zealander exchanges.
Have feedback on this article? Concerned about the content? Get in touch with us directly. Alternatively, email editorial-team (at) simplywallst.com.
This article by Simply Wall St is general in nature. We provide commentary based on historical data and analyst forecasts only using an unbiased methodology and our articles are not intended to be financial advice. It does not constitute a recommendation to buy or sell any stock, and does not take account of your objectives, or your financial situation. We aim to bring you long-term focused analysis driven by fundamental data. Note that our analysis may not factor in the latest price-sensitive company announcements or qualitative material. Simply Wall St has no position in any stocks mentioned.
