
 Yahoo Finance
 Green Cross Health (NZSE:GXH) Knows How To Allocate Capital
If we want to find a stock that could multiply over the long term, what are the underlying trends we should look for? Amongst other things, we'll want to see two things; firstly, a growing return on capital employed (ROCE) and secondly, an expansion in the company's amount of capital employed. If you see this, it typically means it's a company with a great business model and plenty of profitable reinvestment opportunities. With that in mind, the ROCE of Green Cross Health (NZSE:GXH) looks attractive right now, so lets see what the trend of returns can tell us.
Understanding Return On Capital Employed (ROCE)
For those that aren't sure what ROCE is, it measures the amount of pre-tax profits a company can generate from the capital employed in its business. Analysts use this formula to calculate it for Green Cross Health:
Return on Capital Employed = Earnings Before Interest and Tax (EBIT) ÷ (Total Assets - Current Liabilities)
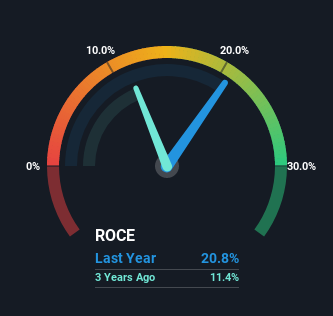
0.21 = NZ$57m ÷ (NZ$415m - NZ$139m) (Based on the trailing twelve months to September 2022).
So, Green Cross Health has an ROCE of 21%. While that is an outstanding return, the rest of the Consumer Retailing industry generates similar returns, on average.
View our latest analysis for Green Cross Health
While the past is not representative of the future, it can be helpful to know how a company has performed historically, which is why we have this chart above. If you want to delve into the historical earnings, revenue and cash flow of Green Cross Health, check out these free graphs here.
So How Is Green Cross Health's ROCE Trending?
Green Cross Health deserves to be commended in regards to it's returns. The company has consistently earned 21% for the last five years, and the capital employed within the business has risen 64% in that time. Now considering ROCE is an attractive 21%, this combination is actually pretty appealing because it means the business can consistently put money to work and generate these high returns. If these trends can continue, it wouldn't surprise us if the company became a multi-bagger.
The Bottom Line On Green Cross Health's ROCE
In the end, the company has proven it can reinvest it's capital at high rates of returns, which you'll remember is a trait of a multi-bagger. Despite the good fundamentals, total returns from the stock have been virtually flat over the last five years. That's why we think it'd be worthwhile to look further into this stock given the fundamentals are appealing.
Green Cross Health does have some risks though, and we've spotted 1 warning sign for Green Cross Health that you might be interested in.
If you want to search for more stocks that have been earning high returns, check out this free list of stocks with solid balance sheets that are also earning high returns on equity.
Have feedback on this article? Concerned about the content? Get in touch with us directly. Alternatively, email editorial-team (at) simplywallst.com.
This article by Simply Wall St is general in nature. We provide commentary based on historical data and analyst forecasts only using an unbiased methodology and our articles are not intended to be financial advice. It does not constitute a recommendation to buy or sell any stock, and does not take account of your objectives, or your financial situation. We aim to bring you long-term focused analysis driven by fundamental data. Note that our analysis may not factor in the latest price-sensitive company announcements or qualitative material. Simply Wall St has no position in any stocks mentioned.
Join A Paid User Research Session
You’ll receive a US$30 Amazon Gift card for 1 hour of your time while helping us build better investing tools for the individual investors like yourself. Sign up here
