
 Yahoo Finance
 Greenbrook TMS (TSE:GTMS) shareholders have endured a 79% loss from investing in the stock three years ago
As an investor, mistakes are inevitable. But really bad investments should be rare. So take a moment to sympathize with the long term shareholders of Greenbrook TMS Inc. (TSE:GTMS), who have seen the share price tank a massive 79% over a three year period. That might cause some serious doubts about the merits of the initial decision to buy the stock, to put it mildly. And over the last year the share price fell 42%, so we doubt many shareholders are delighted. Shareholders have had an even rougher run lately, with the share price down 28% in the last 90 days.
Since shareholders are down over the longer term, lets look at the underlying fundamentals over the that time and see if they've been consistent with returns.
See our latest analysis for Greenbrook TMS
Given that Greenbrook TMS didn't make a profit in the last twelve months, we'll focus on revenue growth to form a quick view of its business development. Shareholders of unprofitable companies usually expect strong revenue growth. That's because fast revenue growth can be easily extrapolated to forecast profits, often of considerable size.
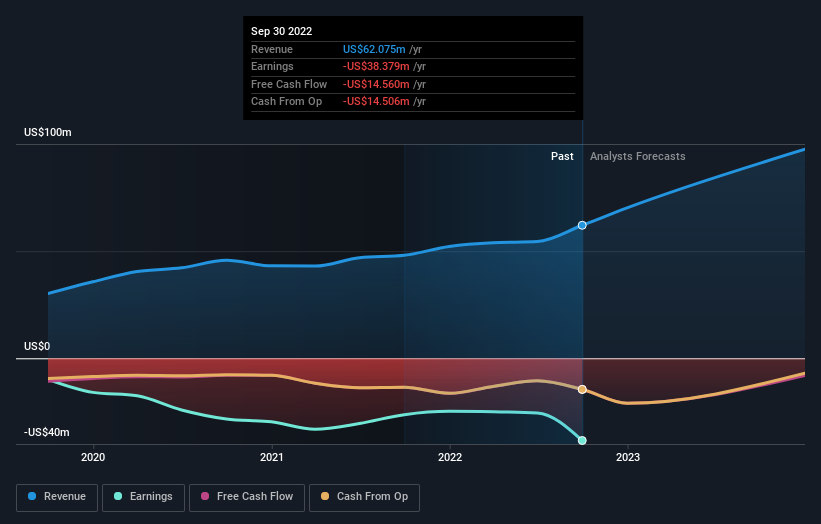
Over three years, Greenbrook TMS grew revenue at 18% per year. That's a fairly respectable growth rate. So it's hard to believe the share price decline of 21% per year is due to the revenue. It could be that the losses were much larger than expected. This is exactly why investors need to diversify - even when a loss making company grows revenue, it can fail to deliver for shareholders.
The company's revenue and earnings (over time) are depicted in the image below (click to see the exact numbers).
Take a more thorough look at Greenbrook TMS' financial health with this free report on its balance sheet.
A Different Perspective
Greenbrook TMS shareholders are down 42% for the year, falling short of the market return. Meanwhile, the broader market slid about 0.04%, likely weighing on the stock. The three-year loss of 21% per year isn't as bad as the last twelve months, suggesting that the company has not been able to convince the market it has solved its problems. We would be wary of buying into a company with unsolved problems, although some investors will buy into struggling stocks if they believe the price is sufficiently attractive. While it is well worth considering the different impacts that market conditions can have on the share price, there are other factors that are even more important. Like risks, for instance. Every company has them, and we've spotted 5 warning signs for Greenbrook TMS (of which 2 are concerning!) you should know about.
We will like Greenbrook TMS better if we see some big insider buys. While we wait, check out this free list of growing companies with considerable, recent, insider buying.
Please note, the market returns quoted in this article reflect the market weighted average returns of stocks that currently trade on CA exchanges.
Have feedback on this article? Concerned about the content? Get in touch with us directly. Alternatively, email editorial-team (at) simplywallst.com.
This article by Simply Wall St is general in nature. We provide commentary based on historical data and analyst forecasts only using an unbiased methodology and our articles are not intended to be financial advice. It does not constitute a recommendation to buy or sell any stock, and does not take account of your objectives, or your financial situation. We aim to bring you long-term focused analysis driven by fundamental data. Note that our analysis may not factor in the latest price-sensitive company announcements or qualitative material. Simply Wall St has no position in any stocks mentioned.
Join A Paid User Research Session
You’ll receive a US$30 Amazon Gift card for 1 hour of your time while helping us build better investing tools for the individual investors like yourself. Sign up here
