
 Yahoo Finance
 GreenSky (NASDAQ:GSKY) May Have Issues Allocating Its Capital
There are a few key trends to look for if we want to identify the next multi-bagger. Typically, we'll want to notice a trend of growing return on capital employed (ROCE) and alongside that, an expanding base of capital employed. Put simply, these types of businesses are compounding machines, meaning they are continually reinvesting their earnings at ever-higher rates of return. Having said that, from a first glance at GreenSky (NASDAQ:GSKY) we aren't jumping out of our chairs at how returns are trending, but let's have a deeper look.
Return On Capital Employed (ROCE): What is it?
If you haven't worked with ROCE before, it measures the 'return' (pre-tax profit) a company generates from capital employed in its business. Analysts use this formula to calculate it for GreenSky:
Return on Capital Employed = Earnings Before Interest and Tax (EBIT) ÷ (Total Assets - Current Liabilities)
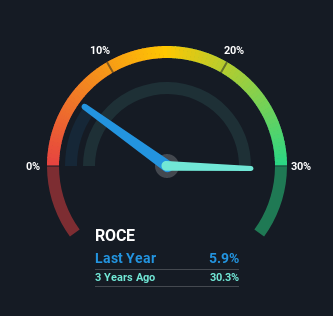
0.059 = US$63m ÷ (US$1.4b - US$297m) (Based on the trailing twelve months to March 2021).
So, GreenSky has an ROCE of 5.9%. Ultimately, that's a low return and it under-performs the IT industry average of 11%.
Check out our latest analysis for GreenSky
In the above chart we have measured GreenSky's prior ROCE against its prior performance, but the future is arguably more important. If you'd like, you can check out the forecasts from the analysts covering GreenSky here for free.
What Can We Tell From GreenSky's ROCE Trend?
When we looked at the ROCE trend at GreenSky, we didn't gain much confidence. To be more specific, ROCE has fallen from 58% over the last five years. On the other hand, the company has been employing more capital without a corresponding improvement in sales in the last year, which could suggest these investments are longer term plays. It's worth keeping an eye on the company's earnings from here on to see if these investments do end up contributing to the bottom line.
On a side note, GreenSky's current liabilities have increased over the last five years to 22% of total assets, effectively distorting the ROCE to some degree. Without this increase, it's likely that ROCE would be even lower than 5.9%. While the ratio isn't currently too high, it's worth keeping an eye on this because if it gets particularly high, the business could then face some new elements of risk.
The Key Takeaway
Bringing it all together, while we're somewhat encouraged by GreenSky's reinvestment in its own business, we're aware that returns are shrinking. Moreover, since the stock has crumbled 76% over the last three years, it appears investors are expecting the worst. On the whole, we aren't too inspired by the underlying trends and we think there may be better chances of finding a multi-bagger elsewhere.
GreenSky does have some risks, we noticed 4 warning signs (and 2 which are a bit unpleasant) we think you should know about.
For those who like to invest in solid companies, check out this free list of companies with solid balance sheets and high returns on equity.
This article by Simply Wall St is general in nature. It does not constitute a recommendation to buy or sell any stock, and does not take account of your objectives, or your financial situation. We aim to bring you long-term focused analysis driven by fundamental data. Note that our analysis may not factor in the latest price-sensitive company announcements or qualitative material. Simply Wall St has no position in any stocks mentioned.
Have feedback on this article? Concerned about the content? Get in touch with us directly. Alternatively, email editorial-team (at) simplywallst.com.
