
 Yahoo Finance
 GUD Holdings' (ASX:GUD) investors will be pleased with their notable 47% return over the last year
Passive investing in index funds can generate returns that roughly match the overall market. But one can do better than that by picking better than average stocks (as part of a diversified portfolio). For example, the GUD Holdings Limited (ASX:GUD) share price is up 42% in the last 1 year, clearly besting the market decline of around 0.3% (not including dividends). That's a solid performance by our standards! Unfortunately the longer term returns are not so good, with the stock falling 15% in the last three years.
So let's investigate and see if the longer term performance of the company has been in line with the underlying business' progress.
View our latest analysis for GUD Holdings
To quote Buffett, 'Ships will sail around the world but the Flat Earth Society will flourish. There will continue to be wide discrepancies between price and value in the marketplace...' One flawed but reasonable way to assess how sentiment around a company has changed is to compare the earnings per share (EPS) with the share price.
GUD Holdings was able to grow EPS by 198% in the last twelve months. It's fair to say that the share price gain of 42% did not keep pace with the EPS growth. So it seems like the market has cooled on GUD Holdings, despite the growth. Interesting.
The graphic below depicts how EPS has changed over time (unveil the exact values by clicking on the image).
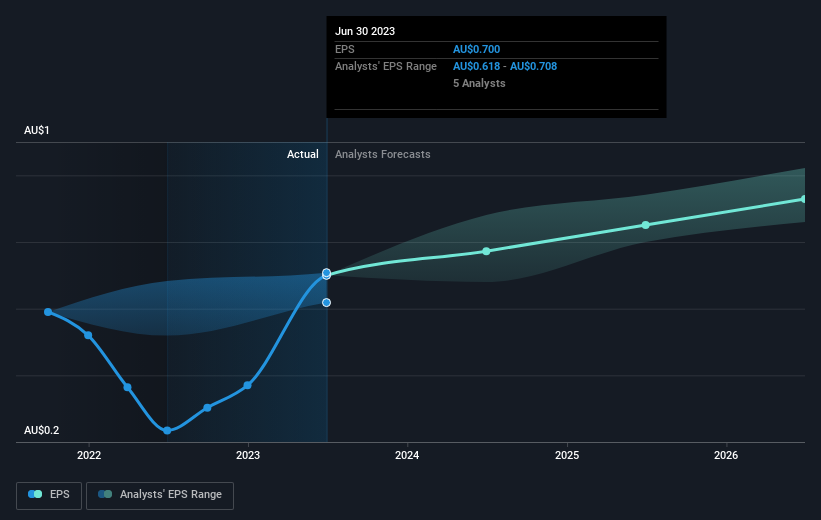
We know that GUD Holdings has improved its bottom line lately, but is it going to grow revenue? Check if analysts think GUD Holdings will grow revenue in the future.
What About Dividends?
As well as measuring the share price return, investors should also consider the total shareholder return (TSR). The TSR is a return calculation that accounts for the value of cash dividends (assuming that any dividend received was reinvested) and the calculated value of any discounted capital raisings and spin-offs. It's fair to say that the TSR gives a more complete picture for stocks that pay a dividend. In the case of GUD Holdings, it has a TSR of 47% for the last 1 year. That exceeds its share price return that we previously mentioned. This is largely a result of its dividend payments!
A Different Perspective
We're pleased to report that GUD Holdings shareholders have received a total shareholder return of 47% over one year. And that does include the dividend. That gain is better than the annual TSR over five years, which is 2%. Therefore it seems like sentiment around the company has been positive lately. Given the share price momentum remains strong, it might be worth taking a closer look at the stock, lest you miss an opportunity. While it is well worth considering the different impacts that market conditions can have on the share price, there are other factors that are even more important. Consider risks, for instance. Every company has them, and we've spotted 2 warning signs for GUD Holdings you should know about.
If you are like me, then you will not want to miss this free list of growing companies that insiders are buying.
Please note, the market returns quoted in this article reflect the market weighted average returns of stocks that currently trade on Australian exchanges.
Have feedback on this article? Concerned about the content? Get in touch with us directly. Alternatively, email editorial-team (at) simplywallst.com.
This article by Simply Wall St is general in nature. We provide commentary based on historical data and analyst forecasts only using an unbiased methodology and our articles are not intended to be financial advice. It does not constitute a recommendation to buy or sell any stock, and does not take account of your objectives, or your financial situation. We aim to bring you long-term focused analysis driven by fundamental data. Note that our analysis may not factor in the latest price-sensitive company announcements or qualitative material. Simply Wall St has no position in any stocks mentioned.
