
 Yahoo Finance
 H C Slingsby (LON:SLNG) Is Doing The Right Things To Multiply Its Share Price
If you're looking for a multi-bagger, there's a few things to keep an eye out for. Amongst other things, we'll want to see two things; firstly, a growing return on capital employed (ROCE) and secondly, an expansion in the company's amount of capital employed. This shows us that it's a compounding machine, able to continually reinvest its earnings back into the business and generate higher returns. Speaking of which, we noticed some great changes in H C Slingsby's (LON:SLNG) returns on capital, so let's have a look.
What Is Return On Capital Employed (ROCE)?
For those who don't know, ROCE is a measure of a company's yearly pre-tax profit (its return), relative to the capital employed in the business. Analysts use this formula to calculate it for H C Slingsby:
Return on Capital Employed = Earnings Before Interest and Tax (EBIT) ÷ (Total Assets - Current Liabilities)
0.047 = UK£499k ÷ (UK£16m - UK£5.5m) (Based on the trailing twelve months to June 2023).
Therefore, H C Slingsby has an ROCE of 4.7%. In absolute terms, that's a low return and it also under-performs the Trade Distributors industry average of 15%.
Check out our latest analysis for H C Slingsby
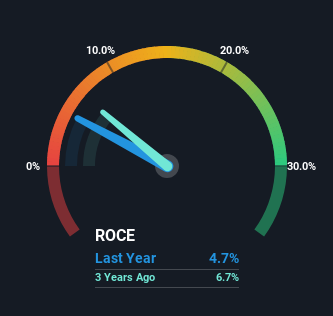
Historical performance is a great place to start when researching a stock so above you can see the gauge for H C Slingsby's ROCE against it's prior returns. If you'd like to look at how H C Slingsby has performed in the past in other metrics, you can view this free graph of H C Slingsby's past earnings, revenue and cash flow.
How Are Returns Trending?
While there are companies with higher returns on capital out there, we still find the trend at H C Slingsby promising. More specifically, while the company has kept capital employed relatively flat over the last five years, the ROCE has climbed 297% in that same time. So our take on this is that the business has increased efficiencies to generate these higher returns, all the while not needing to make any additional investments. On that front, things are looking good so it's worth exploring what management has said about growth plans going forward.
The Key Takeaway
As discussed above, H C Slingsby appears to be getting more proficient at generating returns since capital employed has remained flat but earnings (before interest and tax) are up. And a remarkable 156% total return over the last five years tells us that investors are expecting more good things to come in the future. In light of that, we think it's worth looking further into this stock because if H C Slingsby can keep these trends up, it could have a bright future ahead.
H C Slingsby does come with some risks though, we found 3 warning signs in our investment analysis, and 1 of those doesn't sit too well with us...
If you want to search for solid companies with great earnings, check out this free list of companies with good balance sheets and impressive returns on equity.
Have feedback on this article? Concerned about the content? Get in touch with us directly. Alternatively, email editorial-team (at) simplywallst.com.
This article by Simply Wall St is general in nature. We provide commentary based on historical data and analyst forecasts only using an unbiased methodology and our articles are not intended to be financial advice. It does not constitute a recommendation to buy or sell any stock, and does not take account of your objectives, or your financial situation. We aim to bring you long-term focused analysis driven by fundamental data. Note that our analysis may not factor in the latest price-sensitive company announcements or qualitative material. Simply Wall St has no position in any stocks mentioned.
