
 Yahoo Finance
 H World Group (NASDAQ:HTHT) delivers shareholders respectable 7.9% CAGR over 5 years, surging 3.8% in the last week alone
The main point of investing for the long term is to make money. But more than that, you probably want to see it rise more than the market average. Unfortunately for shareholders, while the H World Group Limited (NASDAQ:HTHT) share price is up 42% in the last five years, that's less than the market return. Unfortunately the share price is down 9.2% in the last year.
The past week has proven to be lucrative for H World Group investors, so let's see if fundamentals drove the company's five-year performance.
View our latest analysis for H World Group
Because H World Group made a loss in the last twelve months, we think the market is probably more focussed on revenue and revenue growth, at least for now. Generally speaking, companies without profits are expected to grow revenue every year, and at a good clip. Some companies are willing to postpone profitability to grow revenue faster, but in that case one does expect good top-line growth.
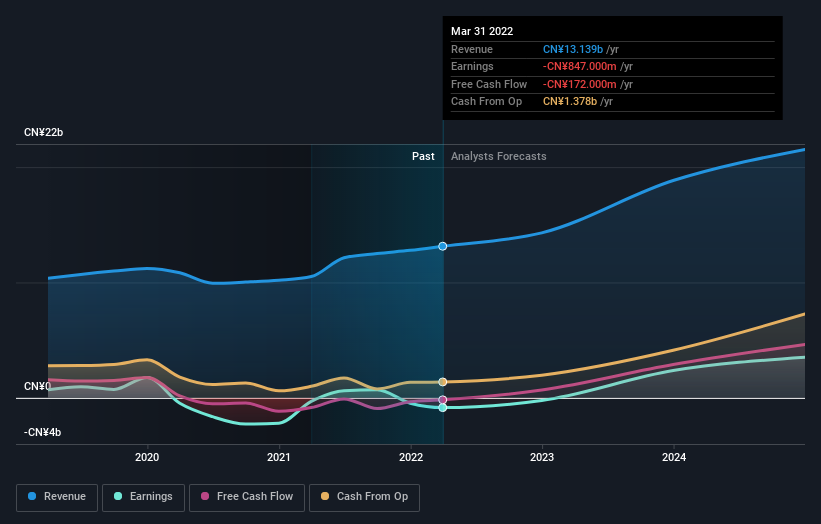
For the last half decade, H World Group can boast revenue growth at a rate of 10% per year. That's a pretty good long term growth rate. While the share price has gained 7% per year for five years, that's hardly amazing considering the market also rose. You could even argue that the share price was over optimistic, previously.
You can see below how earnings and revenue have changed over time (discover the exact values by clicking on the image).
H World Group is a well known stock, with plenty of analyst coverage, suggesting some visibility into future growth. Given we have quite a good number of analyst forecasts, it might be well worth checking out this free chart depicting consensus estimates.
What About The Total Shareholder Return (TSR)?
We've already covered H World Group's share price action, but we should also mention its total shareholder return (TSR). The TSR attempts to capture the value of dividends (as if they were reinvested) as well as any spin-offs or discounted capital raisings offered to shareholders. H World Group's TSR of 46% for the 5 years exceeded its share price return, because it has paid dividends.
A Different Perspective
H World Group shareholders are down 8.7% over twelve months, which isn't far from the market return of -8.3%. The silver lining is that longer term investors would have made a total return of 8% per year over half a decade. If the fundamental data remains strong, and the share price is simply down on sentiment, then this could be an opportunity worth investigating. Shareholders might want to examine this detailed historical graph of past earnings, revenue and cash flow.
If you would prefer to check out another company -- one with potentially superior financials -- then do not miss this free list of companies that have proven they can grow earnings.
Please note, the market returns quoted in this article reflect the market weighted average returns of stocks that currently trade on US exchanges.
Have feedback on this article? Concerned about the content? Get in touch with us directly. Alternatively, email editorial-team (at) simplywallst.com.
This article by Simply Wall St is general in nature. We provide commentary based on historical data and analyst forecasts only using an unbiased methodology and our articles are not intended to be financial advice. It does not constitute a recommendation to buy or sell any stock, and does not take account of your objectives, or your financial situation. We aim to bring you long-term focused analysis driven by fundamental data. Note that our analysis may not factor in the latest price-sensitive company announcements or qualitative material. Simply Wall St has no position in any stocks mentioned.
Join A Paid User Research Session
You’ll receive a US$30 Amazon Gift card for 1 hour of your time while helping us build better investing tools for the individual investors like yourself. Sign up here
