
 Yahoo Finance
 If You Had Bought ASSA ABLOY (STO:ASSA B) Stock Five Years Ago, You Could Pocket A 20% Gain Today
It hasn't been the best quarter for ASSA ABLOY AB (publ) (STO:ASSA B) shareholders, since the share price has fallen 19% in that time. But that doesn't change the fact that the returns over the last five years have been respectable. After all, the stock has performed better than the market (19%) in that time, and is up 20%.
Check out our latest analysis for ASSA ABLOY
While markets are a powerful pricing mechanism, share prices reflect investor sentiment, not just underlying business performance. One way to examine how market sentiment has changed over time is to look at the interaction between a company's share price and its earnings per share (EPS).
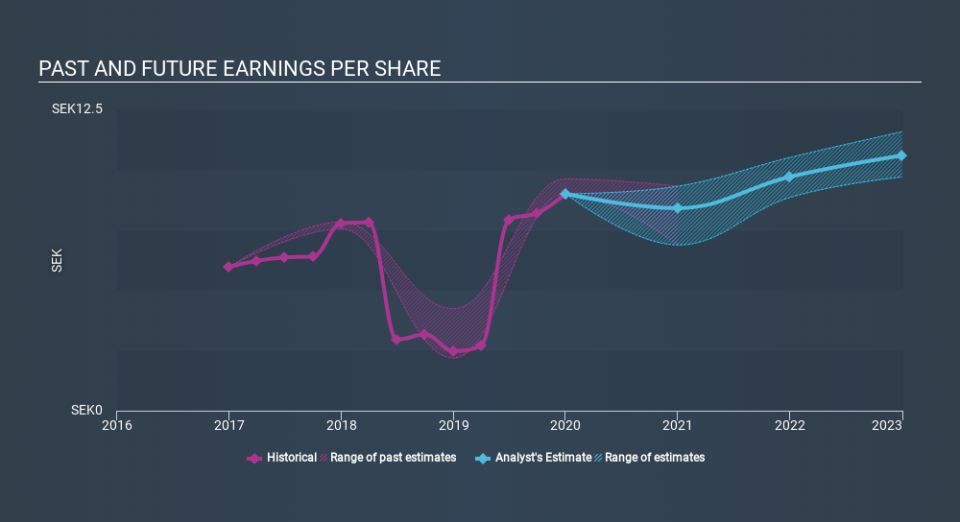
During five years of share price growth, ASSA ABLOY achieved compound earnings per share (EPS) growth of 9.2% per year. This EPS growth is higher than the 3.7% average annual increase in the share price. Therefore, it seems the market has become relatively pessimistic about the company.
You can see below how EPS has changed over time (discover the exact values by clicking on the image).
It's probably worth noting we've seen significant insider buying in the last quarter, which we consider a positive. On the other hand, we think the revenue and earnings trends are much more meaningful measures of the business. Dive deeper into the earnings by checking this interactive graph of ASSA ABLOY's earnings, revenue and cash flow.
What about the Total Shareholder Return (TSR)?
Investors should note that there's a difference between ASSA ABLOY's total shareholder return (TSR) and its share price change, which we've covered above. The TSR attempts to capture the value of dividends (as if they were reinvested) as well as any spin-offs or discounted capital raisings offered to shareholders. ASSA ABLOY's TSR of 30% for the 5 years exceeded its share price return, because it has paid dividends.
A Different Perspective
Although it hurts that ASSA ABLOY returned a loss of 4.9% in the last twelve months, the broader market was actually worse, returning a loss of 5.5%. Of course, the long term returns are far more important and the good news is that over five years, the stock has returned 5.3% for each year. In the best case scenario the last year is just a temporary blip on the journey to a brighter future. It's always interesting to track share price performance over the longer term. But to understand ASSA ABLOY better, we need to consider many other factors. Take risks, for example - ASSA ABLOY has 2 warning signs we think you should be aware of.
If you like to buy stocks alongside management, then you might just love this free list of companies. (Hint: insiders have been buying them).
Please note, the market returns quoted in this article reflect the market weighted average returns of stocks that currently trade on SE exchanges.
If you spot an error that warrants correction, please contact the editor at editorial-team@simplywallst.com. This article by Simply Wall St is general in nature. It does not constitute a recommendation to buy or sell any stock, and does not take account of your objectives, or your financial situation. Simply Wall St has no position in the stocks mentioned.
We aim to bring you long-term focused research analysis driven by fundamental data. Note that our analysis may not factor in the latest price-sensitive company announcements or qualitative material. Thank you for reading.
