
 Yahoo Finance
 If You Had Bought Augean (LON:AUG) Stock A Year Ago, You Could Pocket A 204% Gain Today

Want to participate in a short research study? Help shape the future of investing tools and you could win a $250 gift card!
Unfortunately, investing is risky - companies can and do go bankrupt. But if you pick the right business to buy shares in, you can make more than you can lose. For example, the Augean plc (LON:AUG) share price has soared 204% return in just a single year. On top of that, the share price is up 14% in about a quarter. It is also impressive that the stock is up 125% over three years, adding to the sense that it is a real winner.
See our latest analysis for Augean
While markets are a powerful pricing mechanism, share prices reflect investor sentiment, not just underlying business performance. One way to examine how market sentiment has changed over time is to look at the interaction between a company's share price and its earnings per share (EPS).
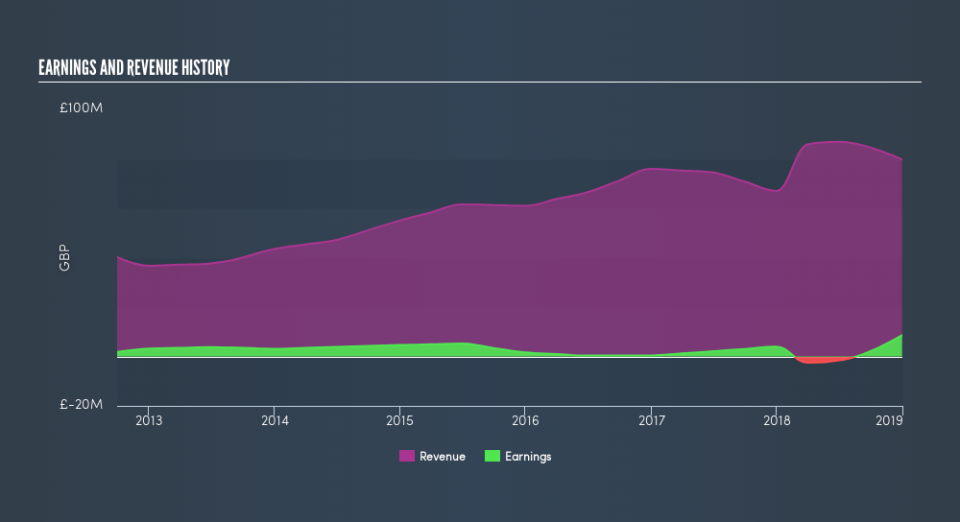
Augean went from making a loss to reporting a profit, in the last year. When a company is just on the edge of profitability it can be well worth considering other metrics in order to more precisely gauge growth (and therefore understand share price movements).
We think that the revenue growth of 19% could have some investors interested. Many businesses do go through a faze where they have to forgo some profits to drive business development, and sometimes its for the best.
You can see how earnings and revenue have changed over time in the image below (click on the chart to see the exact values).
It is of course excellent to see how Augean has grown profits over the years, but the future is more important for shareholders. It might be well worthwhile taking a look at our free report on how its financial position has changed over time.
What about the Total Shareholder Return (TSR)?
We've already covered Augean's share price action, but we should also mention its total shareholder return (TSR). Arguably the TSR is a more complete return calculation because it accounts for the value of dividends (as if they were reinvested), along with the hypothetical value of any discounted capital that have been offered to shareholders. Dividends have been really beneficial for Augean shareholders, and that cash payout contributed to why its TSR of 204%, over the last year, is better than the share price return.
A Different Perspective
We're pleased to report that Augean shareholders have received a total shareholder return of 204% over one year. Since the one-year TSR is better than the five-year TSR (the latter coming in at 19% per year), it would seem that the stock's performance has improved in recent times. Someone with an optimistic perspective could view the recent improvement in TSR as indicating that the business itself is getting better with time. Before forming an opinion on Augean you might want to consider these 3 valuation metrics.
If you would prefer to check out another company -- one with potentially superior financials -- then do not miss this free list of companies that have proven they can grow earnings.
Please note, the market returns quoted in this article reflect the market weighted average returns of stocks that currently trade on GB exchanges.
We aim to bring you long-term focused research analysis driven by fundamental data. Note that our analysis may not factor in the latest price-sensitive company announcements or qualitative material.
If you spot an error that warrants correction, please contact the editor at editorial-team@simplywallst.com. This article by Simply Wall St is general in nature. It does not constitute a recommendation to buy or sell any stock, and does not take account of your objectives, or your financial situation. Simply Wall St has no position in the stocks mentioned. Thank you for reading.
