
 Yahoo Finance
 If You Had Bought Boiron (EPA:BOI) Stock Three Years Ago, You'd Be Sitting On A 59% Loss, Today

If you love investing in stocks you're bound to buy some losers. But the last three years have been particularly tough on longer term Boiron SA (EPA:BOI) shareholders. Sadly for them, the share price is down 59% in that time. The more recent news is of little comfort, with the share price down 30% in a year.
Check out our latest analysis for Boiron
While markets are a powerful pricing mechanism, share prices reflect investor sentiment, not just underlying business performance. One imperfect but simple way to consider how the market perception of a company has shifted is to compare the change in the earnings per share (EPS) with the share price movement.
Boiron saw its EPS decline at a compound rate of 22% per year, over the last three years. This change in EPS is reasonably close to the 26% average annual decrease in the share price. That suggests that the market sentiment around the company hasn't changed much over that time, despite the disappointment. Rather, the share price has approximately tracked EPS growth.
The company's earnings per share (over time) is depicted in the image below (click to see the exact numbers).
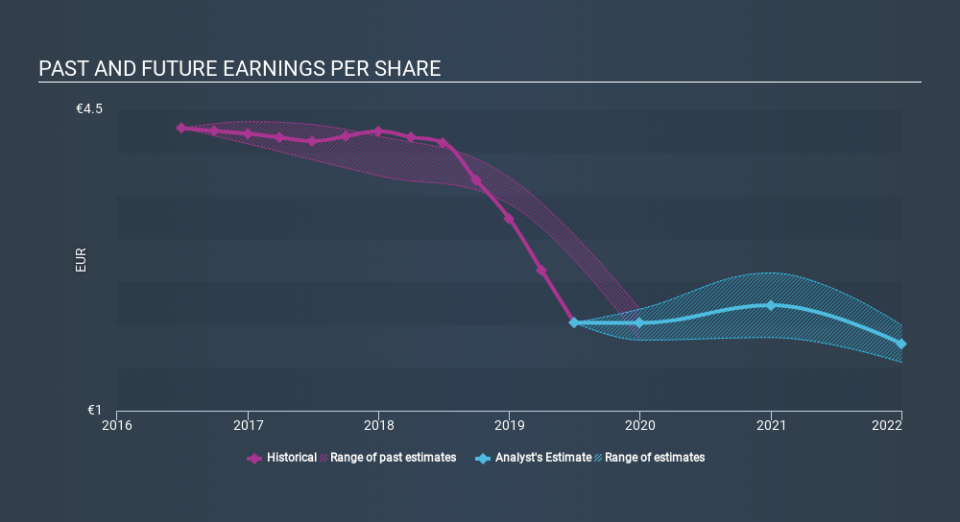
It might be well worthwhile taking a look at our free report on Boiron's earnings, revenue and cash flow.
What About Dividends?
When looking at investment returns, it is important to consider the difference between total shareholder return (TSR) and share price return. The TSR is a return calculation that accounts for the value of cash dividends (assuming that any dividend received was reinvested) and the calculated value of any discounted capital raisings and spin-offs. So for companies that pay a generous dividend, the TSR is often a lot higher than the share price return. As it happens, Boiron's TSR for the last 3 years was -55%, which exceeds the share price return mentioned earlier. This is largely a result of its dividend payments!
A Different Perspective
Boiron shareholders are down 27% for the year (even including dividends) , but the market itself is up 30%. Even the share prices of good stocks drop sometimes, but we want to see improvements in the fundamental metrics of a business, before getting too interested. Regrettably, last year's performance caps off a bad run, with the shareholders facing a total loss of 11% per year over five years. We realise that Buffett has said investors should 'buy when there is blood on the streets', but we caution that investors should first be sure they are buying a high quality businesses. Keeping this in mind, a solid next step might be to take a look at Boiron's dividend track record. This free interactive graph is a great place to start.
Of course Boiron may not be the best stock to buy. So you may wish to see this free collection of growth stocks.
Please note, the market returns quoted in this article reflect the market weighted average returns of stocks that currently trade on FR exchanges.
If you spot an error that warrants correction, please contact the editor at editorial-team@simplywallst.com. This article by Simply Wall St is general in nature. It does not constitute a recommendation to buy or sell any stock, and does not take account of your objectives, or your financial situation. Simply Wall St has no position in the stocks mentioned.
We aim to bring you long-term focused research analysis driven by fundamental data. Note that our analysis may not factor in the latest price-sensitive company announcements or qualitative material. Thank you for reading.
