
 Yahoo Finance
 If You Had Bought FutureFuel (NYSE:FF) Stock A Year Ago, You'd Be Sitting On A 34% Loss, Today

The simplest way to benefit from a rising market is to buy an index fund. While individual stocks can be big winners, plenty more fail to generate satisfactory returns. Investors in FutureFuel Corp. (NYSE:FF) have tasted that bitter downside in the last year, as the share price dropped 34%. That's well bellow the market return of 19%. Longer term shareholders haven't suffered as badly, since the stock is down a comparatively less painful 16% in three years.
See our latest analysis for FutureFuel
While the efficient markets hypothesis continues to be taught by some, it has been proven that markets are over-reactive dynamic systems, and investors are not always rational. By comparing earnings per share (EPS) and share price changes over time, we can get a feel for how investor attitudes to a company have morphed over time.
Unfortunately FutureFuel reported an EPS drop of 74% for the last year. The share price fall of 34% isn't as bad as the reduction in earnings per share. It may have been that the weak EPS was not as bad as some had feared.
You can see how EPS has changed over time in the image below (click on the chart to see the exact values).
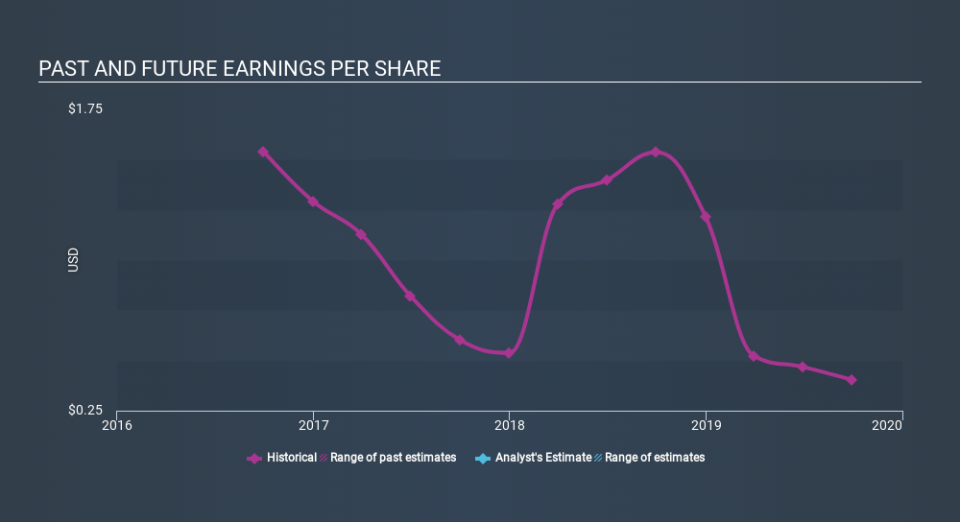
Dive deeper into FutureFuel's key metrics by checking this interactive graph of FutureFuel's earnings, revenue and cash flow.
What about the Total Shareholder Return (TSR)?
Investors should note that there's a difference between FutureFuel's total shareholder return (TSR) and its share price change, which we've covered above. Arguably the TSR is a more complete return calculation because it accounts for the value of dividends (as if they were reinvested), along with the hypothetical value of any discounted capital that have been offered to shareholders. Dividends have been really beneficial for FutureFuel shareholders, and that cash payout explains why its total shareholder loss of 33%, over the last year, isn't as bad as the share price return.
A Different Perspective
While the broader market gained around 19% in the last year, FutureFuel shareholders lost 33% (even including dividends) . Even the share prices of good stocks drop sometimes, but we want to see improvements in the fundamental metrics of a business, before getting too interested. On the bright side, long term shareholders have made money, with a gain of 5.2% per year over half a decade. It could be that the recent sell-off is an opportunity, so it may be worth checking the fundamental data for signs of a long term growth trend. Most investors take the time to check the data on insider transactions. You can click here to see if insiders have been buying or selling.
If you like to buy stocks alongside management, then you might just love this free list of companies. (Hint: insiders have been buying them).
Please note, the market returns quoted in this article reflect the market weighted average returns of stocks that currently trade on US exchanges.
If you spot an error that warrants correction, please contact the editor at editorial-team@simplywallst.com. This article by Simply Wall St is general in nature. It does not constitute a recommendation to buy or sell any stock, and does not take account of your objectives, or your financial situation. Simply Wall St has no position in the stocks mentioned.
We aim to bring you long-term focused research analysis driven by fundamental data. Note that our analysis may not factor in the latest price-sensitive company announcements or qualitative material. Thank you for reading.
