
 Yahoo Finance
 If You Had Bought GDI Property Group (ASX:GDI) Stock A Year Ago, You'd Be Sitting On A 23% Loss, Today

The simplest way to benefit from a rising market is to buy an index fund. While individual stocks can be big winners, plenty more fail to generate satisfactory returns. That downside risk was realized by GDI Property Group (ASX:GDI) shareholders over the last year, as the share price declined 23%. That's disappointing when you consider the market declined 12%. Longer term shareholders haven't suffered as badly, since the stock is down a comparatively less painful 1.9% in three years. The share price has dropped 32% in three months. But this could be related to the weak market, which is down 22% in the same period.
View our latest analysis for GDI Property Group
In his essay The Superinvestors of Graham-and-Doddsville Warren Buffett described how share prices do not always rationally reflect the value of a business. One imperfect but simple way to consider how the market perception of a company has shifted is to compare the change in the earnings per share (EPS) with the share price movement.
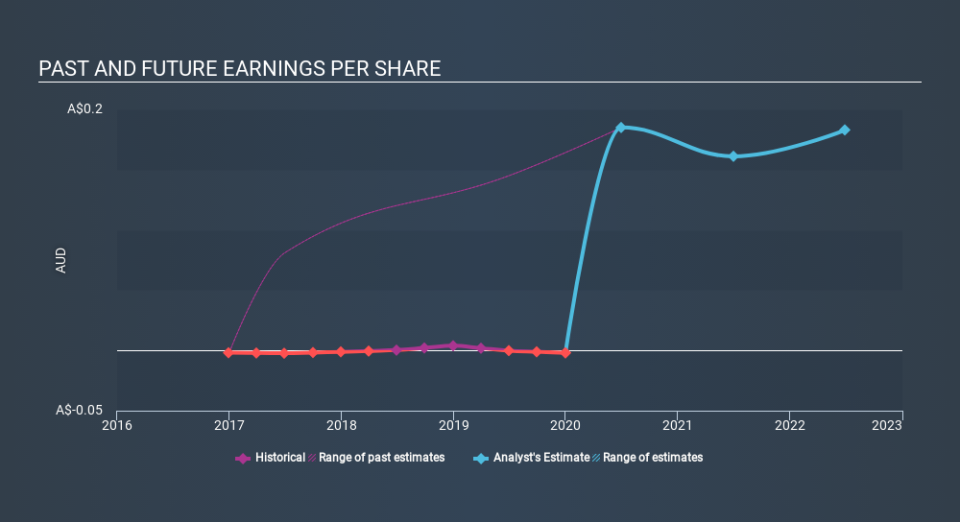
During the last year GDI Property Group saw its earnings per share drop below zero. While this may prove temporary, we'd consider it a negative, so it doesn't surprise us that the stock price is down. Of course, if the company can turn the situation around, investors will likely profit.
You can see how EPS has changed over time in the image below (click on the chart to see the exact values).
It is of course excellent to see how GDI Property Group has grown profits over the years, but the future is more important for shareholders. If you are thinking of buying or selling GDI Property Group stock, you should check out this FREE detailed report on its balance sheet.
What About Dividends?
As well as measuring the share price return, investors should also consider the total shareholder return (TSR). The TSR incorporates the value of any spin-offs or discounted capital raisings, along with any dividends, based on the assumption that the dividends are reinvested. It's fair to say that the TSR gives a more complete picture for stocks that pay a dividend. We note that for GDI Property Group the TSR over the last year was -19%, which is better than the share price return mentioned above. This is largely a result of its dividend payments!
A Different Perspective
While the broader market lost about 12% in the twelve months, GDI Property Group shareholders did even worse, losing 19% (even including dividends) . Having said that, it's inevitable that some stocks will be oversold in a falling market. The key is to keep your eyes on the fundamental developments. Longer term investors wouldn't be so upset, since they would have made 9.6%, each year, over five years. If the fundamental data continues to indicate long term sustainable growth, the current sell-off could be an opportunity worth considering. It's always interesting to track share price performance over the longer term. But to understand GDI Property Group better, we need to consider many other factors. For example, we've discovered 2 warning signs for GDI Property Group that you should be aware of before investing here.
For those who like to find winning investments this free list of growing companies with recent insider purchasing, could be just the ticket.
Please note, the market returns quoted in this article reflect the market weighted average returns of stocks that currently trade on AU exchanges.
Love or hate this article? Concerned about the content? Get in touch with us directly. Alternatively, email editorial-team@simplywallst.com.
This article by Simply Wall St is general in nature. It does not constitute a recommendation to buy or sell any stock, and does not take account of your objectives, or your financial situation. We aim to bring you long-term focused analysis driven by fundamental data. Note that our analysis may not factor in the latest price-sensitive company announcements or qualitative material. Simply Wall St has no position in any stocks mentioned. Thank you for reading.
