
 Yahoo Finance
 If You Had Bought Joules Group (LON:JOUL) Shares Three Years Ago You'd Have Made 29%

It hasn't been the best quarter for Joules Group Plc (LON:JOUL) shareholders, since the share price has fallen 11% in that time. But at least the stock is up over the last three years. Arguably you'd have been better off buying an index fund, because the gain of 29% in three years isn't amazing.
Want to participate in a short research study? Help shape the future of investing tools and you could win a $250 gift card!
View our latest analysis for Joules Group
To paraphrase Benjamin Graham: Over the short term the market is a voting machine, but over the long term it's a weighing machine. One way to examine how market sentiment has changed over time is to look at the interaction between a company's share price and its earnings per share (EPS).
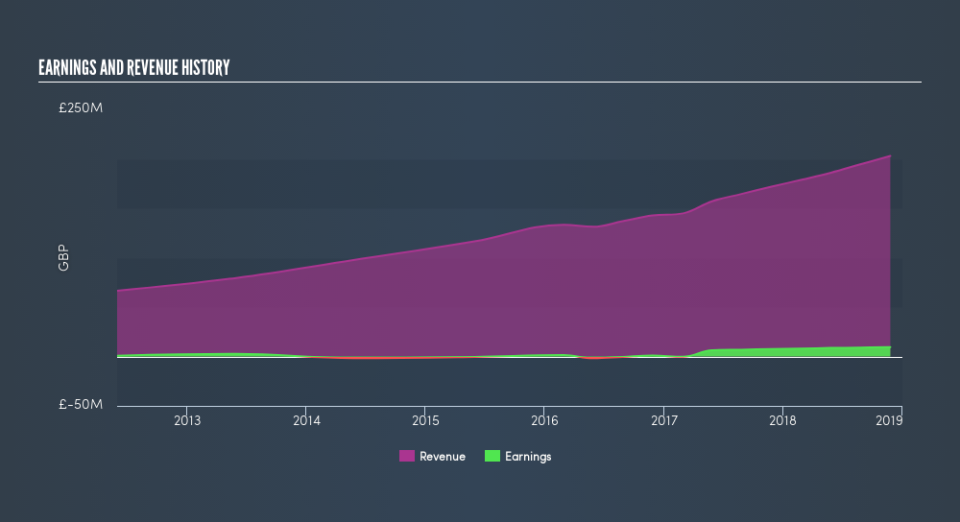
Over the last three years, Joules Group failed to grow earnings per share, which fell 78% (annualized). Thus, it seems unlikely that the market is focussed on EPS growth at the moment. Given this situation, it makes sense to look at other metrics too.
Languishing at just 0.8%, we doubt the dividend is doing much to prop up the share price. It may well be that Joules Group revenue growth rate of 17% over three years has convinced shareholders to believe in a brighter future. If the company is being managed for the long term good, today's shareholders might be right to hold on.
The chart below shows how revenue and earnings have changed with time, (if you click on the chart you can see the actual values).
We know that Joules Group has improved its bottom line lately, but what does the future have in store? So we recommend checking out this free report showing consensus forecasts
What About Dividends?
As well as measuring the share price return, investors should also consider the total shareholder return (TSR). Whereas the share price return only reflects the change in the share price, the TSR includes the value of dividends (assuming they were reinvested) and the benefit of any discounted capital raising or spin-off. Arguably, the TSR gives a more comprehensive picture of the return generated by a stock. We note that for Joules Group the TSR over the last 3 years was 31%, which is better than the share price return mentioned above. The dividends paid by the company have thusly boosted the total shareholder return.
A Different Perspective
Joules Group shareholders are down 27% for the year (even including dividends), falling short of the market return. The market shed around 1.1%, no doubt weighing on the stock price. Investors are up over three years, booking 9.4% per year, much better than the more recent returns. Sometimes when a good quality long term winner has a weak period, it's turns out to be an opportunity, but you really need to be sure that the quality is there. Before forming an opinion on Joules Group you might want to consider these 3 valuation metrics.
If you like to buy stocks alongside management, then you might just love this free list of companies. (Hint: insiders have been buying them).
Please note, the market returns quoted in this article reflect the market weighted average returns of stocks that currently trade on GB exchanges.
We aim to bring you long-term focused research analysis driven by fundamental data. Note that our analysis may not factor in the latest price-sensitive company announcements or qualitative material.
If you spot an error that warrants correction, please contact the editor at editorial-team@simplywallst.com. This article by Simply Wall St is general in nature. It does not constitute a recommendation to buy or sell any stock, and does not take account of your objectives, or your financial situation. Simply Wall St has no position in the stocks mentioned. Thank you for reading.
