
 Yahoo Finance
 If You Had Bought Kinross Gold (TSE:K) Shares Five Years Ago You'd Have Earned 351% Returns
It hasn't been the best quarter for Kinross Gold Corporation (TSE:K) shareholders, since the share price has fallen 15% in that time. But that doesn't change the fact that the returns over the last half decade have been spectacular. In fact, during that period, the share price climbed 351%. Impressive! So it might be that some shareholders are taking profits after good performance. Only time will tell if there is still too much optimism currently reflected in the share price.
Check out our latest analysis for Kinross Gold
To paraphrase Benjamin Graham: Over the short term the market is a voting machine, but over the long term it's a weighing machine. One imperfect but simple way to consider how the market perception of a company has shifted is to compare the change in the earnings per share (EPS) with the share price movement.
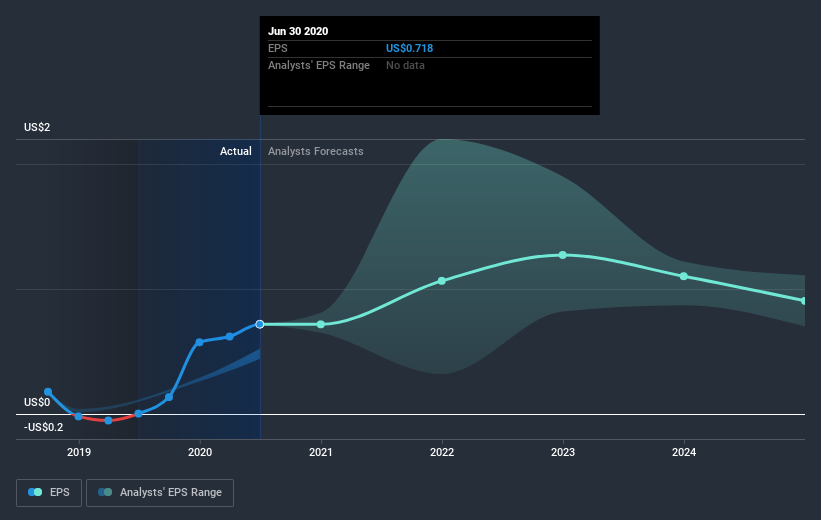
During the last half decade, Kinross Gold became profitable. Sometimes, the start of profitability is a major inflection point that can signal fast earnings growth to come, which in turn justifies very strong share price gains. Since the company was unprofitable five years ago, but not three years ago, it's worth taking a look at the returns in the last three years, too. We can see that the Kinross Gold share price is up 93% in the last three years. In the same period, EPS is up 155% per year. This EPS growth is higher than the 24% average annual increase in the share price over the same three years. So you might conclude the market is a little more cautious about the stock, these days. This unenthusiastic sentiment is reflected in the stock's reasonably modest P/E ratio of 11.29.
The image below shows how EPS has tracked over time (if you click on the image you can see greater detail).
We consider it positive that insiders have made significant purchases in the last year. Having said that, most people consider earnings and revenue growth trends to be a more meaningful guide to the business. This free interactive report on Kinross Gold's earnings, revenue and cash flow is a great place to start, if you want to investigate the stock further.
A Different Perspective
It's good to see that Kinross Gold has rewarded shareholders with a total shareholder return of 93% in the last twelve months. And that does include the dividend. That's better than the annualised return of 35% over half a decade, implying that the company is doing better recently. Someone with an optimistic perspective could view the recent improvement in TSR as indicating that the business itself is getting better with time. While it is well worth considering the different impacts that market conditions can have on the share price, there are other factors that are even more important. For example, we've discovered 1 warning sign for Kinross Gold that you should be aware of before investing here.
If you like to buy stocks alongside management, then you might just love this free list of companies. (Hint: insiders have been buying them).
Please note, the market returns quoted in this article reflect the market weighted average returns of stocks that currently trade on CA exchanges.
This article by Simply Wall St is general in nature. It does not constitute a recommendation to buy or sell any stock, and does not take account of your objectives, or your financial situation. We aim to bring you long-term focused analysis driven by fundamental data. Note that our analysis may not factor in the latest price-sensitive company announcements or qualitative material. Simply Wall St has no position in any stocks mentioned.
Have feedback on this article? Concerned about the content? Get in touch with us directly. Alternatively, email editorial-team@simplywallst.com.
