
 Yahoo Finance
 If You Had Bought Manolete Partners' (LON:MANO) Shares A Year Ago You Would Be Down 45%
Passive investing in an index fund is a good way to ensure your own returns roughly match the overall market. Active investors aim to buy stocks that vastly outperform the market - but in the process, they risk under-performance. Unfortunately the Manolete Partners Plc (LON:MANO) share price slid 45% over twelve months. That falls noticeably short of the market decline of around 0.03%. Manolete Partners hasn't been listed for long, so although we're wary of recent listings that perform poorly, it may still prove itself with time. Even worse, it's down 27% in about a month, which isn't fun at all.
Check out our latest analysis for Manolete Partners
While markets are a powerful pricing mechanism, share prices reflect investor sentiment, not just underlying business performance. One flawed but reasonable way to assess how sentiment around a company has changed is to compare the earnings per share (EPS) with the share price.
Even though the Manolete Partners share price is down over the year, its EPS actually improved. It's quite possible that growth expectations may have been unreasonable in the past.
The divergence between the EPS and the share price is quite notable, during the year. But we might find some different metrics explain the share price movements better.
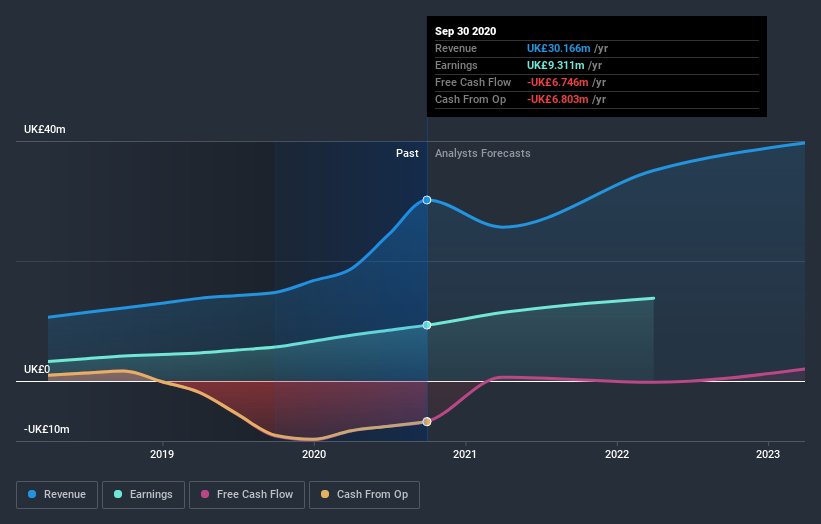
With a low yield of 1.6% we doubt that the dividend influences the share price much. Manolete Partners' revenue is actually up 104% over the last year. Since we can't easily explain the share price movement based on these metrics, it might be worth considering how market sentiment has changed towards the stock.
The image below shows how earnings and revenue have tracked over time (if you click on the image you can see greater detail).
We know that Manolete Partners has improved its bottom line lately, but what does the future have in store? If you are thinking of buying or selling Manolete Partners stock, you should check out this free report showing analyst profit forecasts.
A Different Perspective
Manolete Partners shareholders are down 44% for the year (even including dividends), even worse than the market loss of 0.03%. There's no doubt that's a disappointment, but the stock may well have fared better in a stronger market. With the stock down 24% over the last three months, the market doesn't seem to believe that the company has solved all its problems. Basically, most investors should be wary of buying into a poor-performing stock, unless the business itself has clearly improved. I find it very interesting to look at share price over the long term as a proxy for business performance. But to truly gain insight, we need to consider other information, too. Consider for instance, the ever-present spectre of investment risk. We've identified 4 warning signs with Manolete Partners (at least 1 which is significant) , and understanding them should be part of your investment process.
We will like Manolete Partners better if we see some big insider buys. While we wait, check out this free list of growing companies with considerable, recent, insider buying.
Please note, the market returns quoted in this article reflect the market weighted average returns of stocks that currently trade on GB exchanges.
This article by Simply Wall St is general in nature. It does not constitute a recommendation to buy or sell any stock, and does not take account of your objectives, or your financial situation. We aim to bring you long-term focused analysis driven by fundamental data. Note that our analysis may not factor in the latest price-sensitive company announcements or qualitative material. Simply Wall St has no position in any stocks mentioned.
Have feedback on this article? Concerned about the content? Get in touch with us directly. Alternatively, email editorial-team (at) simplywallst.com.
