
 Yahoo Finance
 If You Had Bought Manulife Financial's (TSE:MFC) Shares Three Years Ago You Would Be Down 26%

While it may not be enough for some shareholders, we think it is good to see the Manulife Financial Corporation (TSE:MFC) share price up 18% in a single quarter. But that doesn't change the fact that the returns over the last three years have been less than pleasing. Truth be told the share price declined 26% in three years and that return, Dear Reader, falls short of what you could have got from passive investing with an index fund.
Check out our latest analysis for Manulife Financial
While the efficient markets hypothesis continues to be taught by some, it has been proven that markets are over-reactive dynamic systems, and investors are not always rational. One way to examine how market sentiment has changed over time is to look at the interaction between a company's share price and its earnings per share (EPS).
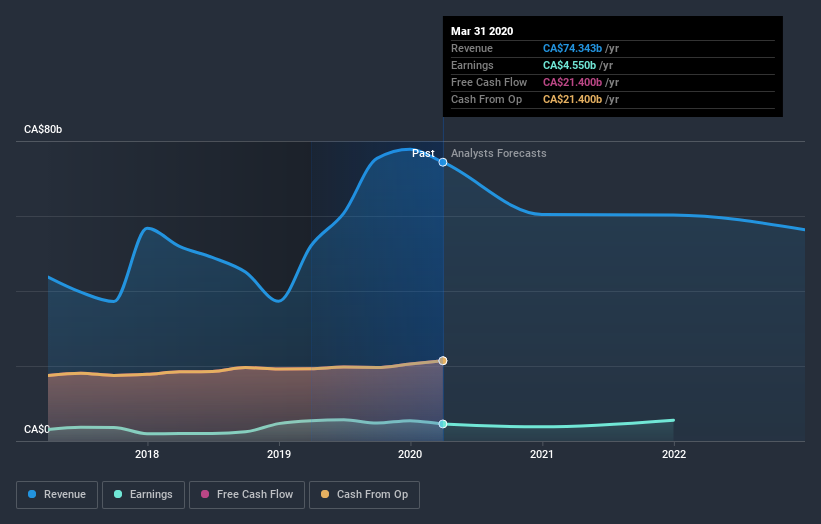
During the unfortunate three years of share price decline, Manulife Financial actually saw its earnings per share (EPS) improve by 14% per year. Given the share price reaction, one might suspect that EPS is not a good guide to the business performance during the period (perhaps due to a one-off loss or gain). Alternatively, growth expectations may have been unreasonable in the past.
It's worth taking a look at other metrics, because the EPS growth doesn't seem to match with the falling share price.
We note that the dividend seems healthy enough, so that probably doesn't explain the share price drop. We like that Manulife Financial has actually grown its revenue over the last three years. If the company can keep growing revenue, there may be an opportunity for investors. You might have to dig deeper to understand the recent share price weakness.
The image below shows how earnings and revenue have tracked over time (if you click on the image you can see greater detail).
This free interactive report on Manulife Financial's balance sheet strength is a great place to start, if you want to investigate the stock further.
What About Dividends?
When looking at investment returns, it is important to consider the difference between total shareholder return (TSR) and share price return. The TSR is a return calculation that accounts for the value of cash dividends (assuming that any dividend received was reinvested) and the calculated value of any discounted capital raisings and spin-offs. So for companies that pay a generous dividend, the TSR is often a lot higher than the share price return. As it happens, Manulife Financial's TSR for the last 3 years was -16%, which exceeds the share price return mentioned earlier. And there's no prize for guessing that the dividend payments largely explain the divergence!
A Different Perspective
While the broader market lost about 4.9% in the twelve months, Manulife Financial shareholders did even worse, losing 18% (even including dividends). Having said that, it's inevitable that some stocks will be oversold in a falling market. The key is to keep your eyes on the fundamental developments. Unfortunately, last year's performance may indicate unresolved challenges, given that it was worse than the annualised loss of 0.1% over the last half decade. Generally speaking long term share price weakness can be a bad sign, though contrarian investors might want to research the stock in hope of a turnaround. It's always interesting to track share price performance over the longer term. But to understand Manulife Financial better, we need to consider many other factors. Even so, be aware that Manulife Financial is showing 2 warning signs in our investment analysis , you should know about...
If you like to buy stocks alongside management, then you might just love this free list of companies. (Hint: insiders have been buying them).
Please note, the market returns quoted in this article reflect the market weighted average returns of stocks that currently trade on CA exchanges.
This article by Simply Wall St is general in nature. It does not constitute a recommendation to buy or sell any stock, and does not take account of your objectives, or your financial situation. We aim to bring you long-term focused analysis driven by fundamental data. Note that our analysis may not factor in the latest price-sensitive company announcements or qualitative material. Simply Wall St has no position in any stocks mentioned.
Have feedback on this article? Concerned about the content? Get in touch with us directly. Alternatively, email editorial-team@simplywallst.com.
