
 Yahoo Finance
 If You Had Bought Nokian Renkaat Oyj (HEL:NRE1V) Stock A Year Ago, You’d Be Sitting On A 17% Loss, Today

Nokian Renkaat Oyj (HEL:NRE1V) shareholders should be happy to see the share price up 18% in the last quarter. But that doesn’t change the reality of under-performance over the last twelve months. In fact the stock is down 17% in the last year, well below the market return.
See our latest analysis for Nokian Renkaat Oyj
There is no denying that markets are sometimes efficient, but prices do not always reflect underlying business performance. One way to examine how market sentiment has changed over time is to look at the interaction between a company’s share price and its earnings per share (EPS).
Even though the Nokian Renkaat Oyj share price is down over the year, its EPS actually improved. It’s quite possible that growth expectations may have been unreasonable in the past. It’s fair to say that the share price does not seem to be reflecting the EPS growth. But we might find some different metrics explain the share price movements better.
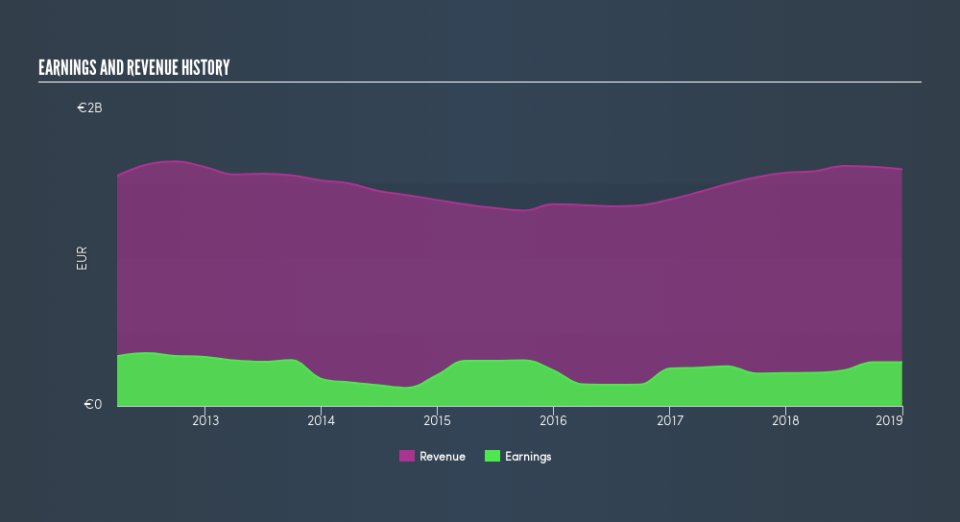
We don’t see any weakness in the Nokian Renkaat Oyj’s dividend so the steady payout can’t really explain the share price drop. From what we can see, revenue is pretty flat, so that doesn’t really explain the share price drop. Of course, it could simply be that it simply fell short of the market consensus expectations.
The graphic below shows how revenue and earnings have changed as management guided the business forward. If you want to see cashflow, you can click on the chart.
It’s probably worth noting that the CEO is paid less than the median at similar sized companies. It’s always worth keeping an eye on CEO pay, but a more important question is whether the company will grow earnings throughout the years. So we recommend checking out this free report showing consensus forecasts
What About Dividends?
It is important to consider the total shareholder return, as well as the share price return, for any given stock. The TSR is a return calculation that accounts for the value of cash dividends (assuming that any dividend received was reinvested) and the calculated value of any discounted capital raisings. Arguably, the TSR gives a more comprehensive picture of the return generated by a stock. We note that for Nokian Renkaat Oyj the TSR over the last year was -13%, which is better than the share price return mentioned above. This is largely a result of its dividend payments!
A Different Perspective
Investors in Nokian Renkaat Oyj had a tough year, with a total loss of 13% (including dividends), against a market gain of about 2.9%. Even the share prices of good stocks drop sometimes, but we want to see improvements in the fundamental metrics of a business, before getting too interested. On the bright side, long term shareholders have made money, with a gain of 6.4% per year over half a decade. If the fundamental data continues to indicate long term sustainable growth, the current sell-off could be an opportunity worth considering. Keeping this in mind, a solid next step might be to take a look at Nokian Renkaat Oyj’s dividend track record. This free interactive graph is a great place to start.
If you like to buy stocks alongside management, then you might just love this free list of companies. (Hint: insiders have been buying them).
Please note, the market returns quoted in this article reflect the market weighted average returns of stocks that currently trade on FI exchanges.
We aim to bring you long-term focused research analysis driven by fundamental data. Note that our analysis may not factor in the latest price-sensitive company announcements or qualitative material.
If you spot an error that warrants correction, please contact the editor at editorial-team@simplywallst.com. This article by Simply Wall St is general in nature. It does not constitute a recommendation to buy or sell any stock, and does not take account of your objectives, or your financial situation. Simply Wall St has no position in the stocks mentioned. Thank you for reading.
