
 Yahoo Finance
 If You Had Bought UK Commercial Property REIT (LON:UKCM) Shares Three Years Ago You'd Have Made 12%

Want to participate in a short research study? Help shape the future of investing tools and you could win a $250 gift card!
Low-cost index funds make it easy to achieve average market returns. But in any diversified portfolio of stocks, you'll see some that fall short of the average. That's what has happened with the UK Commercial Property REIT Limited (LON:UKCM) share price. It's up 12% over three years, but that is below the market return. In the last year the stock price gained, albeit only 4.0%.
Check out our latest analysis for UK Commercial Property REIT
While markets are a powerful pricing mechanism, share prices reflect investor sentiment, not just underlying business performance. One imperfect but simple way to consider how the market perception of a company has shifted is to compare the change in the earnings per share (EPS) with the share price movement.
During the three years of share price growth, UK Commercial Property REIT actually saw its earnings per share (EPS) drop 15% per year. Earnings per share have melted like a stack of ice cubes, in stark contrast to the share price. So we'll need to take a look at some different metrics to try to understand why the share price remains solid.
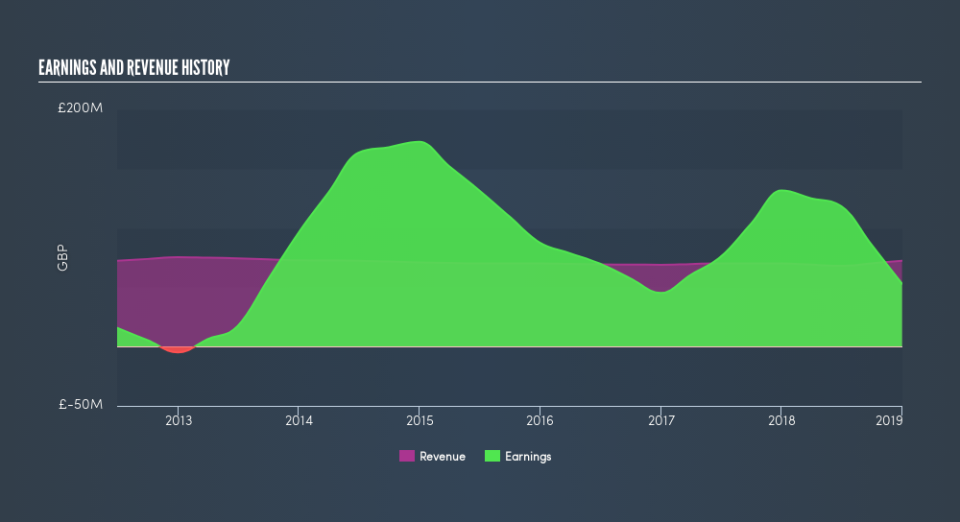
We doubt the dividend payments explain the share price rise, since we don't see any improvement in that regard. And revenue growth isn't impressive. It may be that a closer look at revenue trends can explain the share price.
Depicted in the graphic below, you'll see revenue and earnings over time. If you want more detail, you can click on the chart itself.
Balance sheet strength is crucual. It might be well worthwhile taking a look at our free report on how its financial position has changed over time.
What About Dividends?
As well as measuring the share price return, investors should also consider the total shareholder return (TSR). The TSR is a return calculation that accounts for the value of cash dividends (assuming that any dividend received was reinvested) and the calculated value of any discounted capital raisings and spin-offs. It's fair to say that the TSR gives a more complete picture for stocks that pay a dividend. As it happens, UK Commercial Property REIT's TSR for the last 3 years was 27%, which exceeds the share price return mentioned earlier. And there's no prize for guessing that the dividend payments largely explain the divergence!
A Different Perspective
It's good to see that UK Commercial Property REIT has rewarded shareholders with a total shareholder return of 8.5% in the last twelve months. Of course, that includes the dividend. That's better than the annualised return of 6.4% over half a decade, implying that the company is doing better recently. In the best case scenario, this may hint at some real business momentum, implying that now could be a great time to delve deeper. Before spending more time on UK Commercial Property REIT it might be wise to click here to see if insiders have been buying or selling shares.
If you like to buy stocks alongside management, then you might just love this free list of companies. (Hint: insiders have been buying them).
Please note, the market returns quoted in this article reflect the market weighted average returns of stocks that currently trade on GB exchanges.
We aim to bring you long-term focused research analysis driven by fundamental data. Note that our analysis may not factor in the latest price-sensitive company announcements or qualitative material.
If you spot an error that warrants correction, please contact the editor at editorial-team@simplywallst.com. This article by Simply Wall St is general in nature. It does not constitute a recommendation to buy or sell any stock, and does not take account of your objectives, or your financial situation. Simply Wall St has no position in the stocks mentioned. Thank you for reading.
