
 Yahoo Finance
 If You Had Bought Vodafone Group (LON:VOD) Stock Five Years Ago, You'd Be Sitting On A 31% Loss, Today
Ideally, your overall portfolio should beat the market average. But every investor is virtually certain to have both over-performing and under-performing stocks. So we wouldn't blame long term Vodafone Group Plc (LON:VOD) shareholders for doubting their decision to hold, with the stock down 31% over a half decade. The good news is that the stock is up 2.5% in the last week.
See our latest analysis for Vodafone Group
Vodafone Group isn't currently profitable, so most analysts would look to revenue growth to get an idea of how fast the underlying business is growing. Shareholders of unprofitable companies usually expect strong revenue growth. As you can imagine, fast revenue growth, when maintained, often leads to fast profit growth.
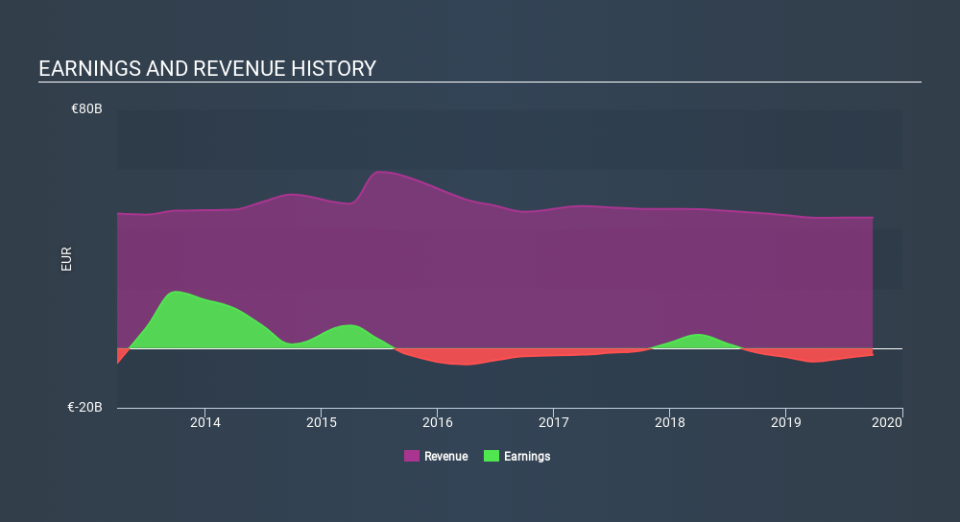
Over half a decade Vodafone Group reduced its trailing twelve month revenue by 4.5% for each year. While far from catastrophic that is not good. The stock hasn't done well for shareholders in the last five years, falling 7.2%, annualized. Unfortunately, though, it makes sense given the lack of either profits or revenue growth. Without profits, its hard to see how shareholders win if the revenue keeps falling.
You can see how earnings and revenue have changed over time in the image below (click on the chart to see the exact values).
Vodafone Group is a well known stock, with plenty of analyst coverage, suggesting some visibility into future growth. So we recommend checking out this free report showing consensus forecasts
What About Dividends?
When looking at investment returns, it is important to consider the difference between total shareholder return (TSR) and share price return. Whereas the share price return only reflects the change in the share price, the TSR includes the value of dividends (assuming they were reinvested) and the benefit of any discounted capital raising or spin-off. So for companies that pay a generous dividend, the TSR is often a lot higher than the share price return. As it happens, Vodafone Group's TSR for the last 5 years was -8.2%, which exceeds the share price return mentioned earlier. This is largely a result of its dividend payments!
A Different Perspective
It's good to see that Vodafone Group has rewarded shareholders with a total shareholder return of 17% in the last twelve months. And that does include the dividend. Notably the five-year annualised TSR loss of 1.7% per year compares very unfavourably with the recent share price performance. The long term loss makes us cautious, but the short term TSR gain certainly hints at a brighter future. It's always interesting to track share price performance over the longer term. But to understand Vodafone Group better, we need to consider many other factors. Take risks, for example - Vodafone Group has 3 warning signs (and 1 which makes us a bit uncomfortable) we think you should know about.
If you are like me, then you will not want to miss this free list of growing companies that insiders are buying.
Please note, the market returns quoted in this article reflect the market weighted average returns of stocks that currently trade on GB exchanges.
If you spot an error that warrants correction, please contact the editor at editorial-team@simplywallst.com. This article by Simply Wall St is general in nature. It does not constitute a recommendation to buy or sell any stock, and does not take account of your objectives, or your financial situation. Simply Wall St has no position in the stocks mentioned.
We aim to bring you long-term focused research analysis driven by fundamental data. Note that our analysis may not factor in the latest price-sensitive company announcements or qualitative material. Thank you for reading.
