
 Yahoo Finance
 Is Halfords Group plc (LON:HFD) Expensive For A Reason? A Look At Its Intrinsic Value
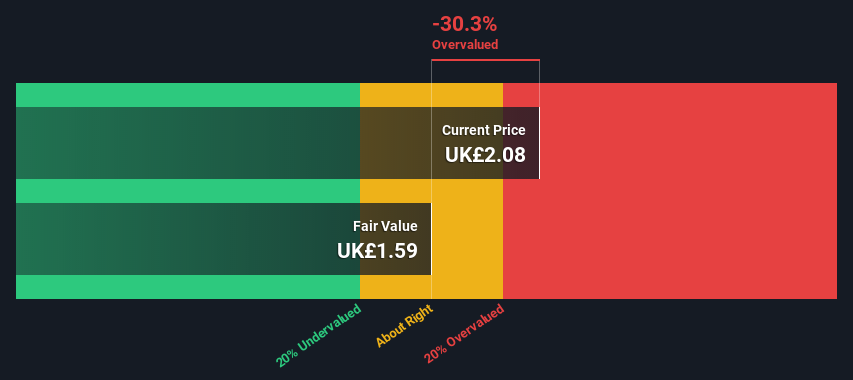
Key Insights
Halfords Group's estimated fair value is UK£1.59 based on 2 Stage Free Cash Flow to Equity
Halfords Group's UK£2.08 share price signals that it might be 30% overvalued
The UK£2.01 analyst price target for HFD is 26% more than our estimate of fair value
In this article we are going to estimate the intrinsic value of Halfords Group plc (LON:HFD) by projecting its future cash flows and then discounting them to today's value. One way to achieve this is by employing the Discounted Cash Flow (DCF) model. There's really not all that much to it, even though it might appear quite complex.
Companies can be valued in a lot of ways, so we would point out that a DCF is not perfect for every situation. If you still have some burning questions about this type of valuation, take a look at the Simply Wall St analysis model.
Check out our latest analysis for Halfords Group
What's The Estimated Valuation?
We're using the 2-stage growth model, which simply means we take in account two stages of company's growth. In the initial period the company may have a higher growth rate and the second stage is usually assumed to have a stable growth rate. To start off with, we need to estimate the next ten years of cash flows. Where possible we use analyst estimates, but when these aren't available we extrapolate the previous free cash flow (FCF) from the last estimate or reported value. We assume companies with shrinking free cash flow will slow their rate of shrinkage, and that companies with growing free cash flow will see their growth rate slow, over this period. We do this to reflect that growth tends to slow more in the early years than it does in later years.
Generally we assume that a dollar today is more valuable than a dollar in the future, and so the sum of these future cash flows is then discounted to today's value:
10-year free cash flow (FCF) forecast
2023 | 2024 | 2025 | 2026 | 2027 | 2028 | 2029 | 2030 | 2031 | 2032 | |
Levered FCF (£, Millions) | UK£18.0m | UK£28.0m | UK£42.4m | UK£41.1m | UK£40.3m | UK£39.9m | UK£39.8m | UK£39.8m | UK£40.0m | UK£40.2m |
Growth Rate Estimate Source | Analyst x6 | Analyst x6 | Analyst x4 | Est @ -3.19% | Est @ -1.89% | Est @ -0.98% | Est @ -0.34% | Est @ 0.11% | Est @ 0.42% | Est @ 0.64% |
Present Value (£, Millions) Discounted @ 11% | UK£16.2 | UK£22.6 | UK£30.9 | UK£26.9 | UK£23.7 | UK£21.1 | UK£18.9 | UK£17.0 | UK£15.4 | UK£13.9 |
("Est" = FCF growth rate estimated by Simply Wall St)
Present Value of 10-year Cash Flow (PVCF) = UK£206m
The second stage is also known as Terminal Value, this is the business's cash flow after the first stage. The Gordon Growth formula is used to calculate Terminal Value at a future annual growth rate equal to the 5-year average of the 10-year government bond yield of 1.2%. We discount the terminal cash flows to today's value at a cost of equity of 11%.
Terminal Value (TV)= FCF2032 × (1 + g) ÷ (r – g) = UK£40m× (1 + 1.2%) ÷ (11%– 1.2%) = UK£405m
Present Value of Terminal Value (PVTV)= TV / (1 + r)10= UK£405m÷ ( 1 + 11%)10= UK£140m
The total value is the sum of cash flows for the next ten years plus the discounted terminal value, which results in the Total Equity Value, which in this case is UK£346m. To get the intrinsic value per share, we divide this by the total number of shares outstanding. Compared to the current share price of UK£2.1, the company appears potentially overvalued at the time of writing. Remember though, that this is just an approximate valuation, and like any complex formula - garbage in, garbage out.
Important Assumptions
We would point out that the most important inputs to a discounted cash flow are the discount rate and of course the actual cash flows. Part of investing is coming up with your own evaluation of a company's future performance, so try the calculation yourself and check your own assumptions. The DCF also does not consider the possible cyclicality of an industry, or a company's future capital requirements, so it does not give a full picture of a company's potential performance. Given that we are looking at Halfords Group as potential shareholders, the cost of equity is used as the discount rate, rather than the cost of capital (or weighted average cost of capital, WACC) which accounts for debt. In this calculation we've used 11%, which is based on a levered beta of 1.443. Beta is a measure of a stock's volatility, compared to the market as a whole. We get our beta from the industry average beta of globally comparable companies, with an imposed limit between 0.8 and 2.0, which is a reasonable range for a stable business.
SWOT Analysis for Halfords Group
Strength
Debt is not viewed as a risk.
Dividends are covered by earnings and cash flows.
Weakness
Earnings declined over the past year.
Dividend is low compared to the top 25% of dividend payers in the Specialty Retail market.
Opportunity
Annual earnings are forecast to grow for the next 3 years.
Good value based on P/E ratio compared to estimated Fair P/E ratio.
Threat
Annual earnings are forecast to grow slower than the British market.
Next Steps:
Valuation is only one side of the coin in terms of building your investment thesis, and it is only one of many factors that you need to assess for a company. DCF models are not the be-all and end-all of investment valuation. Instead the best use for a DCF model is to test certain assumptions and theories to see if they would lead to the company being undervalued or overvalued. For instance, if the terminal value growth rate is adjusted slightly, it can dramatically alter the overall result. Can we work out why the company is trading at a premium to intrinsic value? For Halfords Group, there are three pertinent items you should look at:
Risks: Be aware that Halfords Group is showing 1 warning sign in our investment analysis , you should know about...
Future Earnings: How does HFD's growth rate compare to its peers and the wider market? Dig deeper into the analyst consensus number for the upcoming years by interacting with our free analyst growth expectation chart.
Other High Quality Alternatives: Do you like a good all-rounder? Explore our interactive list of high quality stocks to get an idea of what else is out there you may be missing!
PS. Simply Wall St updates its DCF calculation for every British stock every day, so if you want to find the intrinsic value of any other stock just search here.
Have feedback on this article? Concerned about the content? Get in touch with us directly. Alternatively, email editorial-team (at) simplywallst.com.
This article by Simply Wall St is general in nature. We provide commentary based on historical data and analyst forecasts only using an unbiased methodology and our articles are not intended to be financial advice. It does not constitute a recommendation to buy or sell any stock, and does not take account of your objectives, or your financial situation. We aim to bring you long-term focused analysis driven by fundamental data. Note that our analysis may not factor in the latest price-sensitive company announcements or qualitative material. Simply Wall St has no position in any stocks mentioned.
Join A Paid User Research Session
You’ll receive a US$30 Amazon Gift card for 1 hour of your time while helping us build better investing tools for the individual investors like yourself. Sign up here
