
 Yahoo Finance
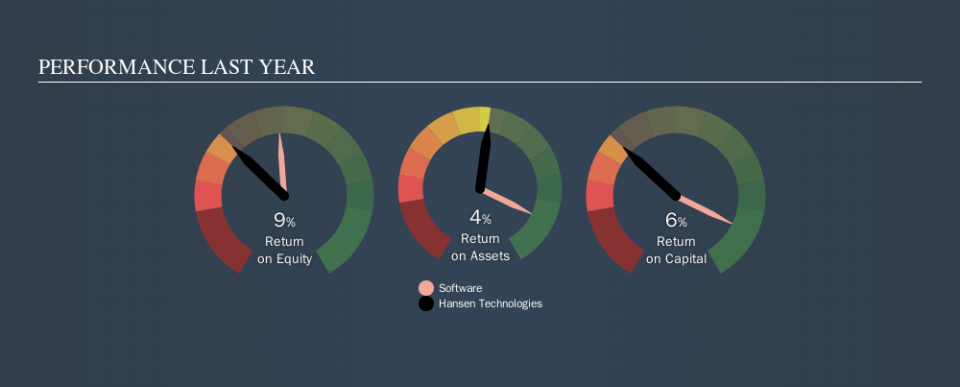
 Is Hansen Technologies Limited (ASX:HSN) Struggling With Its 6.3% Return On Capital Employed?

Today we'll evaluate Hansen Technologies Limited (ASX:HSN) to determine whether it could have potential as an investment idea. Specifically, we'll consider its Return On Capital Employed (ROCE), since that will give us an insight into how efficiently the business can generate profits from the capital it requires.
First, we'll go over how we calculate ROCE. Next, we'll compare it to others in its industry. Last but not least, we'll look at what impact its current liabilities have on its ROCE.
Understanding Return On Capital Employed (ROCE)
ROCE measures the amount of pre-tax profits a company can generate from the capital employed in its business. Generally speaking a higher ROCE is better. Ultimately, it is a useful but imperfect metric. Author Edwin Whiting says to be careful when comparing the ROCE of different businesses, since 'No two businesses are exactly alike.
So, How Do We Calculate ROCE?
The formula for calculating the return on capital employed is:
Return on Capital Employed = Earnings Before Interest and Tax (EBIT) ÷ (Total Assets - Current Liabilities)
Or for Hansen Technologies:
0.063 = AU$30m ÷ (AU$545m - AU$65m) (Based on the trailing twelve months to June 2019.)
So, Hansen Technologies has an ROCE of 6.3%.
See our latest analysis for Hansen Technologies
Does Hansen Technologies Have A Good ROCE?
One way to assess ROCE is to compare similar companies. Using our data, Hansen Technologies's ROCE appears to be significantly below the 17% average in the Software industry. This performance is not ideal, as it suggests the company may not be deploying its capital as effectively as some competitors. Setting aside the industry comparison for now, Hansen Technologies's ROCE is mediocre in absolute terms, considering the risk of investing in stocks versus the safety of a bank account. Investors may wish to consider higher-performing investments.
Hansen Technologies's current ROCE of 6.3% is lower than 3 years ago, when the company reported a 26% ROCE. So investors might consider if it has had issues recently. You can click on the image below to see (in greater detail) how Hansen Technologies's past growth compares to other companies.
Remember that this metric is backwards looking - it shows what has happened in the past, and does not accurately predict the future. ROCE can be deceptive for cyclical businesses, as returns can look incredible in boom times, and terribly low in downturns. This is because ROCE only looks at one year, instead of considering returns across a whole cycle. Since the future is so important for investors, you should check out our free report on analyst forecasts for Hansen Technologies.
What Are Current Liabilities, And How Do They Affect Hansen Technologies's ROCE?
Current liabilities are short term bills and invoices that need to be paid in 12 months or less. Due to the way ROCE is calculated, a high level of current liabilities makes a company look as though it has less capital employed, and thus can (sometimes unfairly) boost the ROCE. To counteract this, we check if a company has high current liabilities, relative to its total assets.
Hansen Technologies has total liabilities of AU$65m and total assets of AU$545m. As a result, its current liabilities are equal to approximately 12% of its total assets. This very reasonable level of current liabilities would not boost the ROCE by much.
What We Can Learn From Hansen Technologies's ROCE
With that in mind, we're not overly impressed with Hansen Technologies's ROCE, so it may not be the most appealing prospect. You might be able to find a better investment than Hansen Technologies. If you want a selection of possible winners, check out this free list of interesting companies that trade on a P/E below 20 (but have proven they can grow earnings).
There are plenty of other companies that have insiders buying up shares. You probably do not want to miss this free list of growing companies that insiders are buying.
We aim to bring you long-term focused research analysis driven by fundamental data. Note that our analysis may not factor in the latest price-sensitive company announcements or qualitative material.
If you spot an error that warrants correction, please contact the editor at editorial-team@simplywallst.com. This article by Simply Wall St is general in nature. It does not constitute a recommendation to buy or sell any stock, and does not take account of your objectives, or your financial situation. Simply Wall St has no position in the stocks mentioned. Thank you for reading.
