
 Yahoo Finance
 Is Harbour Energy plc's (LON:HBR) Stock Price Struggling As A Result Of Its Mixed Financials?
With its stock down 5.2% over the past week, it is easy to disregard Harbour Energy (LON:HBR). It is possible that the markets have ignored the company's differing financials and decided to lean-in to the negative sentiment. Stock prices are usually driven by a company’s financial performance over the long term, and therefore we decided to pay more attention to the company's financial performance. In this article, we decided to focus on Harbour Energy's ROE.
Return on Equity or ROE is a test of how effectively a company is growing its value and managing investors’ money. In simpler terms, it measures the profitability of a company in relation to shareholder's equity.
See our latest analysis for Harbour Energy
How To Calculate Return On Equity?
The formula for return on equity is:
Return on Equity = Net Profit (from continuing operations) ÷ Shareholders' Equity
So, based on the above formula, the ROE for Harbour Energy is:
2.1% = US$32m ÷ US$1.5b (Based on the trailing twelve months to December 2023).
The 'return' refers to a company's earnings over the last year. One way to conceptualize this is that for each £1 of shareholders' capital it has, the company made £0.02 in profit.
What Is The Relationship Between ROE And Earnings Growth?
Thus far, we have learned that ROE measures how efficiently a company is generating its profits. We now need to evaluate how much profit the company reinvests or "retains" for future growth which then gives us an idea about the growth potential of the company. Assuming everything else remains unchanged, the higher the ROE and profit retention, the higher the growth rate of a company compared to companies that don't necessarily bear these characteristics.
A Side By Side comparison of Harbour Energy's Earnings Growth And 2.1% ROE
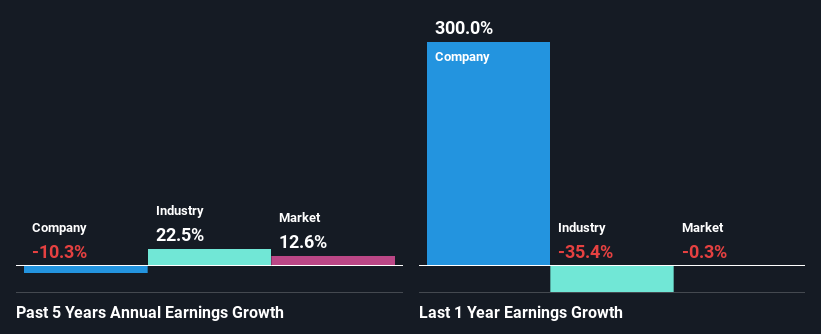
It is quite clear that Harbour Energy's ROE is rather low. Even when compared to the industry average of 13%, the ROE figure is pretty disappointing. Given the circumstances, the significant decline in net income by 10% seen by Harbour Energy over the last five years is not surprising. However, there could also be other factors causing the earnings to decline. For example, the business has allocated capital poorly, or that the company has a very high payout ratio.
So, as a next step, we compared Harbour Energy's performance against the industry and were disappointed to discover that while the company has been shrinking its earnings, the industry has been growing its earnings at a rate of 23% over the last few years.
Earnings growth is a huge factor in stock valuation. It’s important for an investor to know whether the market has priced in the company's expected earnings growth (or decline). This then helps them determine if the stock is placed for a bright or bleak future. One good indicator of expected earnings growth is the P/E ratio which determines the price the market is willing to pay for a stock based on its earnings prospects. So, you may want to check if Harbour Energy is trading on a high P/E or a low P/E, relative to its industry.
Is Harbour Energy Making Efficient Use Of Its Profits?
Looking at its three-year median payout ratio of 27% (or a retention ratio of 73%) which is pretty normal, Harbour Energy's declining earnings is rather baffling as one would expect to see a fair bit of growth when a company is retaining a good portion of its profits. So there could be some other explanations in that regard. For instance, the company's business may be deteriorating.
Only recently, Harbour Energy stated paying a dividend. This likely means that the management might have concluded that its shareholders have a strong preference for dividends. Looking at the current analyst consensus data, we can see that the company's future payout ratio is expected to rise to 195% over the next three years. Regardless, the future ROE for Harbour Energy is speculated to rise to 29% despite the anticipated increase in the payout ratio. There could probably be other factors that could be driving the future growth in the ROE.
Summary
On the whole, we feel that the performance shown by Harbour Energy can be open to many interpretations. While the company does have a high rate of reinvestment, the low ROE means that all that reinvestment is not reaping any benefit to its investors, and moreover, its having a negative impact on the earnings growth. That being so, the latest industry analyst forecasts show that the analysts are expecting to see a huge improvement in the company's earnings growth rate. To know more about the latest analysts predictions for the company, check out this visualization of analyst forecasts for the company.
Have feedback on this article? Concerned about the content? Get in touch with us directly. Alternatively, email editorial-team (at) simplywallst.com.
This article by Simply Wall St is general in nature. We provide commentary based on historical data and analyst forecasts only using an unbiased methodology and our articles are not intended to be financial advice. It does not constitute a recommendation to buy or sell any stock, and does not take account of your objectives, or your financial situation. We aim to bring you long-term focused analysis driven by fundamental data. Note that our analysis may not factor in the latest price-sensitive company announcements or qualitative material. Simply Wall St has no position in any stocks mentioned.
