
 Yahoo Finance
 Some Harvest Minerals (LON:HMI) Shareholders Have Copped A Big 62% Share Price Drop

Want to participate in a short research study? Help shape the future of investing tools and you could win a $250 gift card!
Investing in stocks comes with the risk that the share price will fall. Anyone who held Harvest Minerals Limited (LON:HMI) over the last year knows what a loser feels like. To wit the share price is down 62% in that time. The silver lining (for longer term investors) is that the stock is still 12% higher than it was three years ago. The falls have accelerated recently, with the share price down 40% in the last three months.
Check out our latest analysis for Harvest Minerals
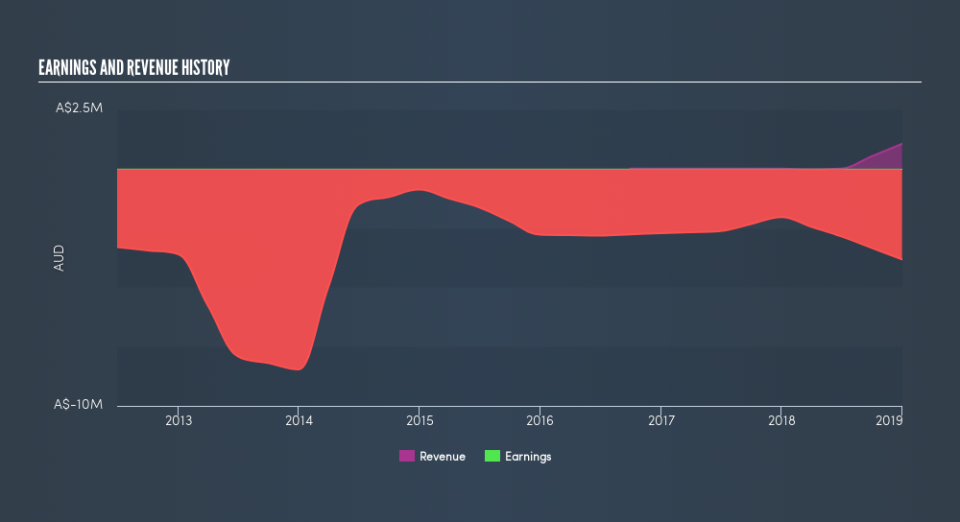
Harvest Minerals isn't currently profitable, so most analysts would look to revenue growth to get an idea of how fast the underlying business is growing. Shareholders of unprofitable companies usually expect strong revenue growth. As you can imagine, fast revenue growth, when maintained, often leads to fast profit growth.
You can see how revenue and earnings have changed over time in the image below, (click on the chart to see cashflow).
You can see how its balance sheet has strengthened (or weakened) over time in this free interactive graphic.
A Different Perspective
Over the last year, Harvest Minerals shareholders took a loss of 62%. In contrast the market gained about 2.7%. However, keep in mind that even the best stocks will sometimes underperform the market over a twelve month period. Fortunately the longer term story is brighter, with total returns averaging about 3.8% per year over three years. The recent sell-off could be an opportunity if the business remains sound, so it may be worth checking the fundamental data for signs of a long-term growth trend. Shareholders might want to examine this detailed historical graph of past earnings, revenue and cash flow.
We will like Harvest Minerals better if we see some big insider buys. While we wait, check out this free list of growing companies with considerable, recent, insider buying.
Please note, the market returns quoted in this article reflect the market weighted average returns of stocks that currently trade on GB exchanges.
We aim to bring you long-term focused research analysis driven by fundamental data. Note that our analysis may not factor in the latest price-sensitive company announcements or qualitative material.
If you spot an error that warrants correction, please contact the editor at editorial-team@simplywallst.com. This article by Simply Wall St is general in nature. It does not constitute a recommendation to buy or sell any stock, and does not take account of your objectives, or your financial situation. Simply Wall St has no position in the stocks mentioned. Thank you for reading.
