
 Yahoo Finance
 Harworth Group (LON:HWG) investors are sitting on a loss of 25% if they invested a year ago
The simplest way to benefit from a rising market is to buy an index fund. When you buy individual stocks, you can make higher profits, but you also face the risk of under-performance. For example, the Harworth Group plc (LON:HWG) share price is down 26% in the last year. That contrasts poorly with the market decline of 0.1%. On the other hand, the stock is actually up 12% over three years.
With that in mind, it's worth seeing if the company's underlying fundamentals have been the driver of long term performance, or if there are some discrepancies.
See our latest analysis for Harworth Group
In his essay The Superinvestors of Graham-and-Doddsville Warren Buffett described how share prices do not always rationally reflect the value of a business. By comparing earnings per share (EPS) and share price changes over time, we can get a feel for how investor attitudes to a company have morphed over time.
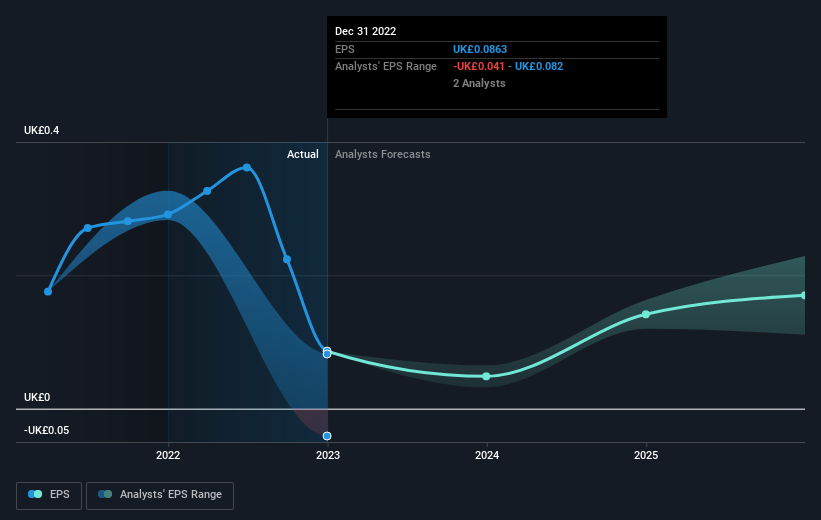
Unhappily, Harworth Group had to report a 70% decline in EPS over the last year. This fall in the EPS is significantly worse than the 26% the share price fall. It may have been that the weak EPS was not as bad as some had feared.
You can see below how EPS has changed over time (discover the exact values by clicking on the image).
We like that insiders have been buying shares in the last twelve months. Having said that, most people consider earnings and revenue growth trends to be a more meaningful guide to the business. Dive deeper into the earnings by checking this interactive graph of Harworth Group's earnings, revenue and cash flow.
A Different Perspective
While the broader market gained around 0.1% in the last year, Harworth Group shareholders lost 25% (even including dividends). Even the share prices of good stocks drop sometimes, but we want to see improvements in the fundamental metrics of a business, before getting too interested. Unfortunately, last year's performance may indicate unresolved challenges, given that it was worse than the annualised loss of 0.4% over the last half decade. We realise that Baron Rothschild has said investors should "buy when there is blood on the streets", but we caution that investors should first be sure they are buying a high quality business. I find it very interesting to look at share price over the long term as a proxy for business performance. But to truly gain insight, we need to consider other information, too. For instance, we've identified 2 warning signs for Harworth Group that you should be aware of.
If you like to buy stocks alongside management, then you might just love this free list of companies. (Hint: insiders have been buying them).
Please note, the market returns quoted in this article reflect the market weighted average returns of stocks that currently trade on British exchanges.
Have feedback on this article? Concerned about the content? Get in touch with us directly. Alternatively, email editorial-team (at) simplywallst.com.
This article by Simply Wall St is general in nature. We provide commentary based on historical data and analyst forecasts only using an unbiased methodology and our articles are not intended to be financial advice. It does not constitute a recommendation to buy or sell any stock, and does not take account of your objectives, or your financial situation. We aim to bring you long-term focused analysis driven by fundamental data. Note that our analysis may not factor in the latest price-sensitive company announcements or qualitative material. Simply Wall St has no position in any stocks mentioned.
Join A Paid User Research Session
You’ll receive a US$30 Amazon Gift card for 1 hour of your time while helping us build better investing tools for the individual investors like yourself. Sign up here
