
 Yahoo Finance
 Hays plc (LON:HAS) Earns A Nice Return On Capital Employed

Today we are going to look at Hays plc (LON:HAS) to see whether it might be an attractive investment prospect. Specifically, we’re going to calculate its Return On Capital Employed (ROCE), in the hopes of getting some insight into the business.
First up, we’ll look at what ROCE is and how we calculate it. Second, we’ll look at its ROCE compared to similar companies. Last but not least, we’ll look at what impact its current liabilities have on its ROCE.
Understanding Return On Capital Employed (ROCE)
ROCE measures the amount of pre-tax profits a company can generate from the capital employed in its business. All else being equal, a better business will have a higher ROCE. Overall, it is a valuable metric that has its flaws. Author Edwin Whiting says to be careful when comparing the ROCE of different businesses, since ‘No two businesses are exactly alike.’
So, How Do We Calculate ROCE?
Analysts use this formula to calculate return on capital employed:
Return on Capital Employed = Earnings Before Interest and Tax (EBIT) ÷ (Total Assets – Current Liabilities)
Or for Hays:
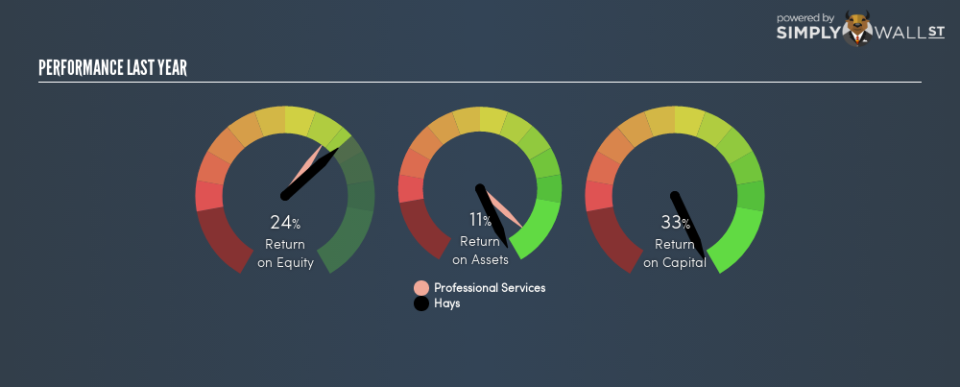
0.33 = UK£241m ÷ (UK£1.5b – UK£785m) (Based on the trailing twelve months to June 2018.)
So, Hays has an ROCE of 33%.
View our latest analysis for Hays
Is Hays’s ROCE Good?
ROCE can be useful when making comparisons, such as between similar companies. Hays’s ROCE appears to be substantially greater than the 22% average in the Professional Services industry. I think that’s good to see, since it implies the company is better than other companies at making the most of its capital. Putting aside its position relative to its industry for now, in absolute terms, Hays’s ROCE is currently very good.
Remember that this metric is backwards looking – it shows what has happened in the past, and does not accurately predict the future. ROCE can be deceptive for cyclical businesses, as returns can look incredible in boom times, and terribly low in downturns. ROCE is only a point-in-time measure. Future performance is what matters, and you can see analyst predictions in our free report on analyst forecasts for the company.
How Hays’s Current Liabilities Impact Its ROCE
Liabilities, such as supplier bills and bank overdrafts, are referred to as current liabilities if they need to be paid within 12 months. Due to the way ROCE is calculated, a high level of current liabilities makes a company look as though it has less capital employed, and thus can (sometimes unfairly) boost the ROCE. To counter this, investors can check if a company has high current liabilities relative to total assets.
Hays has total liabilities of UK£785m and total assets of UK£1.5b. As a result, its current liabilities are equal to approximately 52% of its total assets. While a high level of current liabilities boosts its ROCE, Hays’s returns are still very good.
What We Can Learn From Hays’s ROCE
In my book, this business could be worthy of further research. Of course you might be able to find a better stock than Hays. So you may wish to see this free collection of other companies that have grown earnings strongly.
If you are like me, then you will not want to miss this free list of growing companies that insiders are buying.
To help readers see past the short term volatility of the financial market, we aim to bring you a long-term focused research analysis purely driven by fundamental data. Note that our analysis does not factor in the latest price-sensitive company announcements.
The author is an independent contributor and at the time of publication had no position in the stocks mentioned. For errors that warrant correction please contact the editor at editorial-team@simplywallst.com.
