
 Yahoo Finance
 HCI Group, Inc.'s (NYSE:HCI) Stock Has Seen Strong Momentum: Does That Call For Deeper Study Of Its Financial Prospects?
HCI Group (NYSE:HCI) has had a great run on the share market with its stock up by a significant 25% over the last three months. As most would know, fundamentals are what usually guide market price movements over the long-term, so we decided to look at the company's key financial indicators today to determine if they have any role to play in the recent price movement. Specifically, we decided to study HCI Group's ROE in this article.
Return on equity or ROE is an important factor to be considered by a shareholder because it tells them how effectively their capital is being reinvested. In other words, it is a profitability ratio which measures the rate of return on the capital provided by the company's shareholders.
See our latest analysis for HCI Group
How To Calculate Return On Equity?
ROE can be calculated by using the formula:
Return on Equity = Net Profit (from continuing operations) ÷ Shareholders' Equity
So, based on the above formula, the ROE for HCI Group is:
21% = US$89m ÷ US$423m (Based on the trailing twelve months to December 2023).
The 'return' is the amount earned after tax over the last twelve months. Another way to think of that is that for every $1 worth of equity, the company was able to earn $0.21 in profit.
Why Is ROE Important For Earnings Growth?
So far, we've learned that ROE is a measure of a company's profitability. Based on how much of its profits the company chooses to reinvest or "retain", we are then able to evaluate a company's future ability to generate profits. Assuming everything else remains unchanged, the higher the ROE and profit retention, the higher the growth rate of a company compared to companies that don't necessarily bear these characteristics.
HCI Group's Earnings Growth And 21% ROE
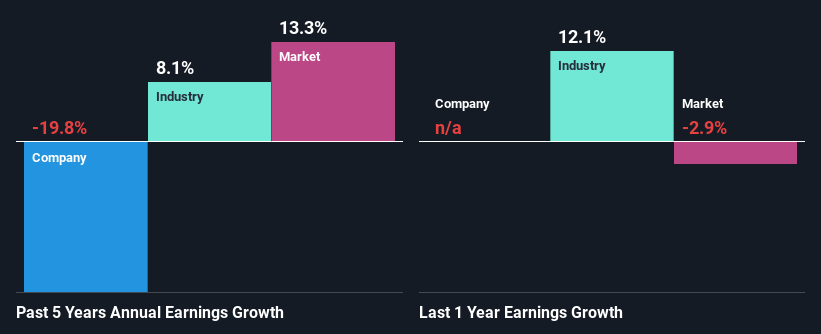
To begin with, HCI Group seems to have a respectable ROE. Especially when compared to the industry average of 13% the company's ROE looks pretty impressive. As you might expect, the 20% net income decline reported by HCI Group is a bit of a surprise. Based on this, we feel that there might be other reasons which haven't been discussed so far in this article that could be hampering the company's growth. Such as, the company pays out a huge portion of its earnings as dividends, or is faced with competitive pressures.
That being said, we compared HCI Group's performance with the industry and were concerned when we found that while the company has shrunk its earnings, the industry has grown its earnings at a rate of 8.1% in the same 5-year period.
Earnings growth is a huge factor in stock valuation. It’s important for an investor to know whether the market has priced in the company's expected earnings growth (or decline). This then helps them determine if the stock is placed for a bright or bleak future. One good indicator of expected earnings growth is the P/E ratio which determines the price the market is willing to pay for a stock based on its earnings prospects. So, you may want to check if HCI Group is trading on a high P/E or a low P/E, relative to its industry.
Is HCI Group Efficiently Re-investing Its Profits?
HCI Group's low three-year median payout ratio of 18% (or a retention ratio of 82%) over the last three years should mean that the company is retaining most of its earnings to fuel its growth but the company's earnings have actually shrunk. The low payout should mean that the company is retaining most of its earnings and consequently, should see some growth. So there could be some other explanations in that regard. For example, the company's business may be deteriorating.
Moreover, HCI Group has been paying dividends for at least ten years or more suggesting that management must have perceived that the shareholders prefer dividends over earnings growth. Upon studying the latest analysts' consensus data, we found that the company is expected to keep paying out approximately 14% of its profits over the next three years. Therefore, the company's future ROE is also not expected to change by much with analysts predicting an ROE of 22%.
Conclusion
Overall, we feel that HCI Group certainly does have some positive factors to consider. Although, we are disappointed to see a lack of growth in earnings even in spite of a high ROE and and a high reinvestment rate. We believe that there might be some outside factors that could be having a negative impact on the business. That being so, the latest industry analyst forecasts show that the analysts are expecting to see a huge improvement in the company's earnings growth rate. To know more about the company's future earnings growth forecasts take a look at this free report on analyst forecasts for the company to find out more.
Have feedback on this article? Concerned about the content? Get in touch with us directly. Alternatively, email editorial-team (at) simplywallst.com.
This article by Simply Wall St is general in nature. We provide commentary based on historical data and analyst forecasts only using an unbiased methodology and our articles are not intended to be financial advice. It does not constitute a recommendation to buy or sell any stock, and does not take account of your objectives, or your financial situation. We aim to bring you long-term focused analysis driven by fundamental data. Note that our analysis may not factor in the latest price-sensitive company announcements or qualitative material. Simply Wall St has no position in any stocks mentioned.
