
 Yahoo Finance
 Has Headlam Group plc's (LON:HEAD) Impressive Stock Performance Got Anything to Do With Its Fundamentals?
Headlam Group's (LON:HEAD) stock is up by a considerable 44% over the past three months. Given that stock prices are usually aligned with a company's financial performance in the long-term, we decided to study its financial indicators more closely to see if they had a hand to play in the recent price move. In this article, we decided to focus on Headlam Group's ROE.
Return on equity or ROE is an important factor to be considered by a shareholder because it tells them how effectively their capital is being reinvested. Put another way, it reveals the company's success at turning shareholder investments into profits.
View our latest analysis for Headlam Group
How To Calculate Return On Equity?
The formula for ROE is:
Return on Equity = Net Profit (from continuing operations) ÷ Shareholders' Equity
So, based on the above formula, the ROE for Headlam Group is:
13% = UK£27m ÷ UK£213m (Based on the trailing twelve months to June 2022).
The 'return' is the amount earned after tax over the last twelve months. So, this means that for every £1 of its shareholder's investments, the company generates a profit of £0.13.
Why Is ROE Important For Earnings Growth?
So far, we've learned that ROE is a measure of a company's profitability. Based on how much of its profits the company chooses to reinvest or "retain", we are then able to evaluate a company's future ability to generate profits. Assuming everything else remains unchanged, the higher the ROE and profit retention, the higher the growth rate of a company compared to companies that don't necessarily bear these characteristics.
A Side By Side comparison of Headlam Group's Earnings Growth And 13% ROE
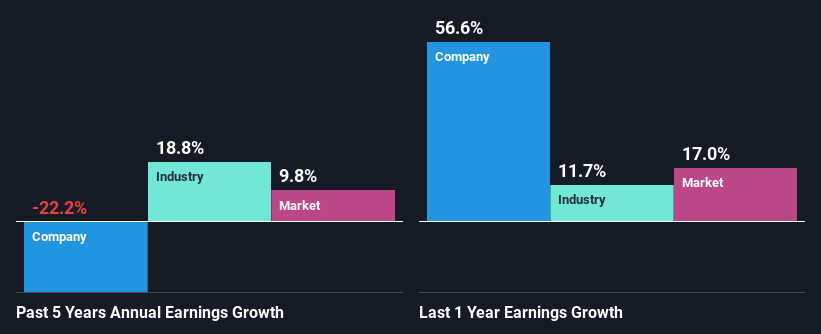
To start with, Headlam Group's ROE looks acceptable. Further, the company's ROE is similar to the industry average of 15%. As you might expect, the 22% net income decline reported by Headlam Group is a bit of a surprise. Based on this, we feel that there might be other reasons which haven't been discussed so far in this article that could be hampering the company's growth. Such as, the company pays out a huge portion of its earnings as dividends, or is faced with competitive pressures.
Furthermore, even when compared to the industry, which has been shrinking its earnings at a rate 4.3% in the same period, we found that Headlam Group's performance is pretty disappointing, as it suggests that the company has been shrunk its earnings at a rate faster than the industry.
The basis for attaching value to a company is, to a great extent, tied to its earnings growth. What investors need to determine next is if the expected earnings growth, or the lack of it, is already built into the share price. By doing so, they will have an idea if the stock is headed into clear blue waters or if swampy waters await. Is Headlam Group fairly valued compared to other companies? These 3 valuation measures might help you decide.
Is Headlam Group Efficiently Re-investing Its Profits?
Looking at its three-year median payout ratio of 44% (or a retention ratio of 56%) which is pretty normal, Headlam Group's declining earnings is rather baffling as one would expect to see a fair bit of growth when a company is retaining a good portion of its profits. So there might be other factors at play here which could potentially be hampering growth. For example, the business has faced some headwinds.
In addition, Headlam Group has been paying dividends over a period of at least ten years suggesting that keeping up dividend payments is way more important to the management even if it comes at the cost of business growth. Our latest analyst data shows that the future payout ratio of the company is expected to rise to 59% over the next three years. Despite the higher expected payout ratio, the company's ROE is not expected to change by much.
Conclusion
Overall, we feel that Headlam Group certainly does have some positive factors to consider. Yet, the low earnings growth is a bit concerning, especially given that the company has a high rate of return and is reinvesting ma huge portion of its profits. By the looks of it, there could be some other factors, not necessarily in control of the business, that's preventing growth. Having said that, we studied the latest analyst forecasts, and found that analysts are expecting the company's earnings growth to improve slightly. Sure enough, this could bring some relief to shareholders. To know more about the latest analysts predictions for the company, check out this visualization of analyst forecasts for the company.
Have feedback on this article? Concerned about the content? Get in touch with us directly. Alternatively, email editorial-team (at) simplywallst.com.
This article by Simply Wall St is general in nature. We provide commentary based on historical data and analyst forecasts only using an unbiased methodology and our articles are not intended to be financial advice. It does not constitute a recommendation to buy or sell any stock, and does not take account of your objectives, or your financial situation. We aim to bring you long-term focused analysis driven by fundamental data. Note that our analysis may not factor in the latest price-sensitive company announcements or qualitative material. Simply Wall St has no position in any stocks mentioned.
Join A Paid User Research Session
You’ll receive a US$30 Amazon Gift card for 1 hour of your time while helping us build better investing tools for the individual investors like yourself. Sign up here
