
 Yahoo Finance
 Healthcare Services Group (NASDAQ:HCSG) stock falls 6.2% in past week as five-year earnings and shareholder returns continue downward trend
Statistically speaking, long term investing is a profitable endeavour. But unfortunately, some companies simply don't succeed. For example the Healthcare Services Group, Inc. (NASDAQ:HCSG) share price dropped 73% over five years. That is extremely sub-optimal, to say the least. And some of the more recent buyers are probably worried, too, with the stock falling 26% in the last year.
Since Healthcare Services Group has shed US$68m from its value in the past 7 days, let's see if the longer term decline has been driven by the business' economics.
See our latest analysis for Healthcare Services Group
In his essay The Superinvestors of Graham-and-Doddsville Warren Buffett described how share prices do not always rationally reflect the value of a business. One imperfect but simple way to consider how the market perception of a company has shifted is to compare the change in the earnings per share (EPS) with the share price movement.
During the five years over which the share price declined, Healthcare Services Group's earnings per share (EPS) dropped by 25% each year. Notably, the share price has fallen at 23% per year, fairly close to the change in the EPS. That suggests that the market sentiment around the company hasn't changed much over that time. Rather, the share price has approximately tracked EPS growth.
The graphic below depicts how EPS has changed over time (unveil the exact values by clicking on the image).
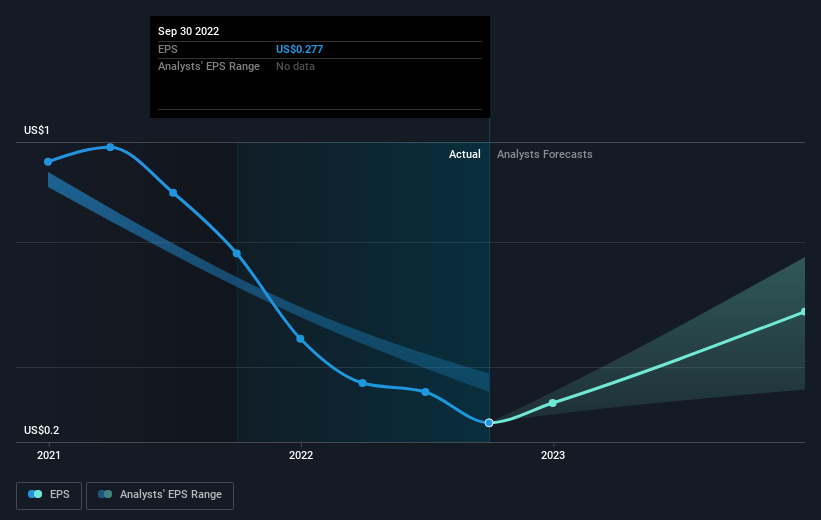
This free interactive report on Healthcare Services Group's earnings, revenue and cash flow is a great place to start, if you want to investigate the stock further.
What About Dividends?
As well as measuring the share price return, investors should also consider the total shareholder return (TSR). The TSR incorporates the value of any spin-offs or discounted capital raisings, along with any dividends, based on the assumption that the dividends are reinvested. Arguably, the TSR gives a more comprehensive picture of the return generated by a stock. In the case of Healthcare Services Group, it has a TSR of -68% for the last 5 years. That exceeds its share price return that we previously mentioned. This is largely a result of its dividend payments!
A Different Perspective
Healthcare Services Group shareholders are down 21% over twelve months (even including dividends), which isn't far from the market return of -21%. So last year was actually even worse than the last five years, which cost shareholders 11% per year. It will probably take a substantial improvement in the fundamental performance for the company to reverse this trend. It's always interesting to track share price performance over the longer term. But to understand Healthcare Services Group better, we need to consider many other factors. Consider for instance, the ever-present spectre of investment risk. We've identified 3 warning signs with Healthcare Services Group (at least 1 which doesn't sit too well with us) , and understanding them should be part of your investment process.
If you are like me, then you will not want to miss this free list of growing companies that insiders are buying.
Please note, the market returns quoted in this article reflect the market weighted average returns of stocks that currently trade on US exchanges.
Have feedback on this article? Concerned about the content? Get in touch with us directly. Alternatively, email editorial-team (at) simplywallst.com.
This article by Simply Wall St is general in nature. We provide commentary based on historical data and analyst forecasts only using an unbiased methodology and our articles are not intended to be financial advice. It does not constitute a recommendation to buy or sell any stock, and does not take account of your objectives, or your financial situation. We aim to bring you long-term focused analysis driven by fundamental data. Note that our analysis may not factor in the latest price-sensitive company announcements or qualitative material. Simply Wall St has no position in any stocks mentioned.
Join A Paid User Research Session
You’ll receive a US$30 Amazon Gift card for 1 hour of your time while helping us build better investing tools for the individual investors like yourself. Sign up here
