
 Yahoo Finance
 HeidelbergCement AG's (FRA:HEI) 3.0% Dividend Yield Looks Pretty Interesting

Is HeidelbergCement AG (FRA:HEI) a good dividend stock? How can we tell? Dividend paying companies with growing earnings can be highly rewarding in the long term. If you are hoping to live on the income from dividends, it's important to be a lot more stringent with your investments than the average punter.
In this case, HeidelbergCement likely looks attractive to investors, given its 3.0% dividend yield and a payment history of over ten years. We'd guess that plenty of investors have purchased it for the income. Some simple analysis can offer a lot of insights when buying a company for its dividend, and we'll go through this below.
Click the interactive chart for our full dividend analysis
Payout ratios
Dividends are usually paid out of company earnings. If a company is paying more than it earns, then the dividend might become unsustainable - hardly an ideal situation. As a result, we should always investigate whether a company can afford its dividend, measured as a percentage of a company's net income after tax. Looking at the data, we can see that 36% of HeidelbergCement's profits were paid out as dividends in the last 12 months. This is a middling range that strikes a nice balance between paying dividends to shareholders, and retaining enough earnings to invest in future growth. One of the risks is that management reinvests the retained capital poorly instead of paying a higher dividend.
In addition to comparing dividends against profits, we should inspect whether the company generated enough cash to pay its dividend. HeidelbergCement paid out a conservative 42% of its free cash flow as dividends last year. It's encouraging to see that the dividend is covered by both profit and cash flow. This generally suggests the dividend is sustainable, as long as earnings don't drop precipitously.
Is HeidelbergCement's Balance Sheet Risky?
As HeidelbergCement has a meaningful amount of debt, we need to check its balance sheet to see if the company might have debt risks. A rough way to check this is with these two simple ratios: a) net debt divided by EBITDA (earnings before interest, tax, depreciation and amortisation), and b) net interest cover. Net debt to EBITDA measures total debt load relative to company earnings (lower = less debt), while net interest cover measures the ability to pay interest on the debt (higher = greater ability to pay interest costs). With net debt of 3.09 times its EBITDA, investors are starting to take on a meaningful amount of risk, should the business enter a downturn.
We calculated its interest cover by measuring its earnings before interest and tax (EBIT), and dividing this by the company's net interest expense. HeidelbergCement has EBIT of 5.85 times its interest expense, which we think is adequate.
We update our data on HeidelbergCement every 24 hours, so you can always get our latest analysis of its financial health, here.
Dividend Volatility
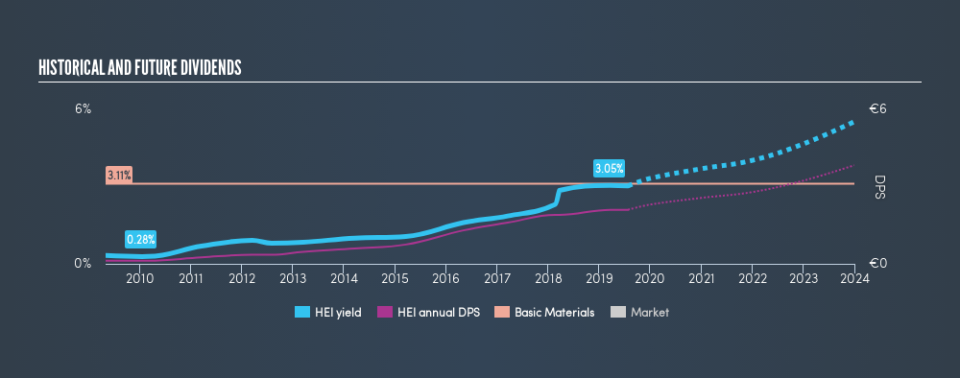
One of the major risks of relying on dividend income, is the potential for a company to struggle financially and cut its dividend. Not only is your income cut, but the value of your investment declines as well - nasty. HeidelbergCement has been paying dividends for a long time, but for the purpose of this analysis, we only examine the past 10 years of payments. The dividend has been stable over the past 10 years, which is great. We think this could suggest some resilience to the business and its dividends. During the past ten-year period, the first annual payment was €0.12 in 2009, compared to €2.10 last year. Dividends per share have grown at approximately 33% per year over this time.
It's rare to find a company that has grown its dividends rapidly over ten years and not had any notable cuts, but HeidelbergCement has done it, which we really like.
Dividend Growth Potential
While dividend payments have been relatively reliable, it would also be nice if earnings per share (EPS) were growing, as this is essential to maintaining the dividend's purchasing power over the long term. It's good to see HeidelbergCement has been growing its earnings per share at 12% a year over the past 5 years. Earnings per share have been growing at a good rate, and the company is paying less than half its earnings as dividends. We generally think this is an attractive combination, as it permits further reinvestment in the business.
Conclusion
When we look at a dividend stock, we need to form a judgement on whether the dividend will grow, if the company is able to maintain it in a wide range of economic circumstances, and if the dividend payout is sustainable. First, we like that the company's dividend payments appear well covered, although the retained capital also needs to be effectively reinvested. Earnings per share have not been growing, but we respect a company that maintains a relatively stable dividend. Overall, we think there are a lot of positives to HeidelbergCement from a dividend perspective.
Companies that are growing earnings tend to be the best dividend stocks over the long term. See what the 23 analysts we track are forecasting for HeidelbergCement for free with public analyst estimates for the company.
We have also put together a list of global stocks with a market capitalisation above $1bn and yielding more 3%.
We aim to bring you long-term focused research analysis driven by fundamental data. Note that our analysis may not factor in the latest price-sensitive company announcements or qualitative material.
If you spot an error that warrants correction, please contact the editor at editorial-team@simplywallst.com. This article by Simply Wall St is general in nature. It does not constitute a recommendation to buy or sell any stock, and does not take account of your objectives, or your financial situation. Simply Wall St has no position in the stocks mentioned. Thank you for reading.
