
 Yahoo Finance
 Helios Underwriting (LON:HUW) shareholders have earned a 7.8% CAGR over the last five years
When we invest, we're generally looking for stocks that outperform the market average. And in our experience, buying the right stocks can give your wealth a significant boost. To wit, the Helios Underwriting share price has climbed 33% in five years, easily topping the market return of 2.8% (ignoring dividends). However, more recent returns haven't been as impressive as that, with the stock returning just 1.1% in the last year , including dividends .
Now it's worth having a look at the company's fundamentals too, because that will help us determine if the long term shareholder return has matched the performance of the underlying business.
View our latest analysis for Helios Underwriting
To quote Buffett, 'Ships will sail around the world but the Flat Earth Society will flourish. There will continue to be wide discrepancies between price and value in the marketplace...' One imperfect but simple way to consider how the market perception of a company has shifted is to compare the change in the earnings per share (EPS) with the share price movement.
During the five years of share price growth, Helios Underwriting moved from a loss to profitability. That would generally be considered a positive, so we'd expect the share price to be up.
The graphic below depicts how EPS has changed over time (unveil the exact values by clicking on the image).
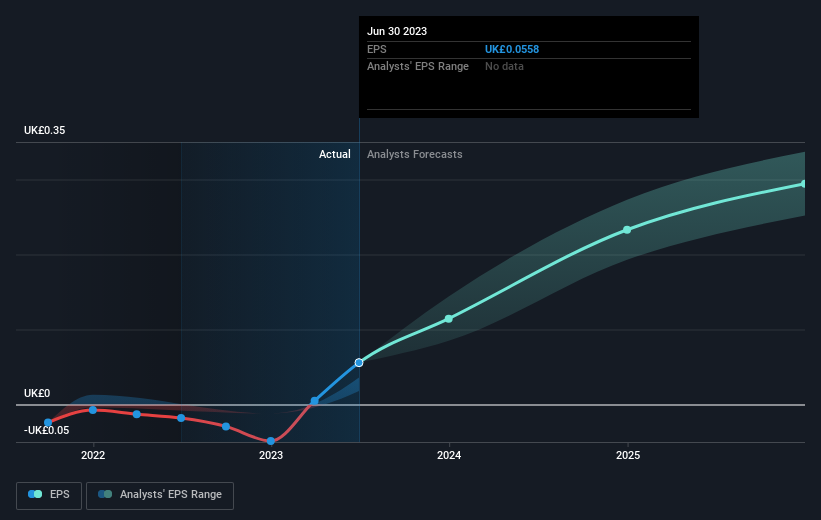
We like that insiders have been buying shares in the last twelve months. Even so, future earnings will be far more important to whether current shareholders make money. Dive deeper into the earnings by checking this interactive graph of Helios Underwriting's earnings, revenue and cash flow.
What About Dividends?
It is important to consider the total shareholder return, as well as the share price return, for any given stock. The TSR incorporates the value of any spin-offs or discounted capital raisings, along with any dividends, based on the assumption that the dividends are reinvested. So for companies that pay a generous dividend, the TSR is often a lot higher than the share price return. As it happens, Helios Underwriting's TSR for the last 5 years was 45%, which exceeds the share price return mentioned earlier. And there's no prize for guessing that the dividend payments largely explain the divergence!
A Different Perspective
Helios Underwriting provided a TSR of 1.1% over the last twelve months. Unfortunately this falls short of the market return. If we look back over five years, the returns are even better, coming in at 8% per year for five years. It may well be that this is a business worth popping on the watching, given the continuing positive reception, over time, from the market. I find it very interesting to look at share price over the long term as a proxy for business performance. But to truly gain insight, we need to consider other information, too. Consider risks, for instance. Every company has them, and we've spotted 1 warning sign for Helios Underwriting you should know about.
If you like to buy stocks alongside management, then you might just love this free list of companies. (Hint: insiders have been buying them).
Please note, the market returns quoted in this article reflect the market weighted average returns of stocks that currently trade on British exchanges.
Have feedback on this article? Concerned about the content? Get in touch with us directly. Alternatively, email editorial-team (at) simplywallst.com.
This article by Simply Wall St is general in nature. We provide commentary based on historical data and analyst forecasts only using an unbiased methodology and our articles are not intended to be financial advice. It does not constitute a recommendation to buy or sell any stock, and does not take account of your objectives, or your financial situation. We aim to bring you long-term focused analysis driven by fundamental data. Note that our analysis may not factor in the latest price-sensitive company announcements or qualitative material. Simply Wall St has no position in any stocks mentioned.
