
 Yahoo Finance
 Here's What B2Gold Corp.'s (TSE:BTO) ROCE Can Tell Us

Want to participate in a short research study? Help shape the future of investing tools and you could win a $250 gift card!
Today we'll evaluate B2Gold Corp. (TSE:BTO) to determine whether it could have potential as an investment idea. Specifically, we're going to calculate its Return On Capital Employed (ROCE), in the hopes of getting some insight into the business.
First up, we'll look at what ROCE is and how we calculate it. Next, we'll compare it to others in its industry. Last but not least, we'll look at what impact its current liabilities have on its ROCE.
Understanding Return On Capital Employed (ROCE)
ROCE measures the 'return' (pre-tax profit) a company generates from capital employed in its business. In general, businesses with a higher ROCE are usually better quality. In brief, it is a useful tool, but it is not without drawbacks. Author Edwin Whiting says to be careful when comparing the ROCE of different businesses, since 'No two businesses are exactly alike.'
So, How Do We Calculate ROCE?
Analysts use this formula to calculate return on capital employed:
Return on Capital Employed = Earnings Before Interest and Tax (EBIT) ÷ (Total Assets - Current Liabilities)
Or for B2Gold:
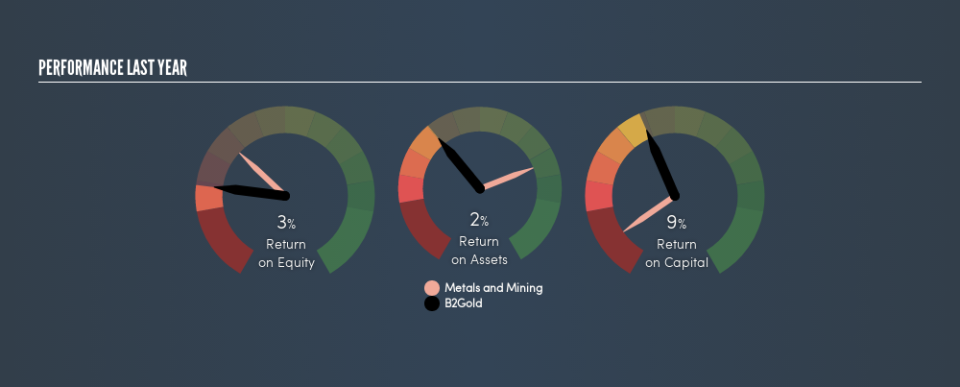
0.092 = US$215m ÷ (US$2.5b - US$207m) (Based on the trailing twelve months to December 2018.)
Therefore, B2Gold has an ROCE of 9.2%.
View our latest analysis for B2Gold
Does B2Gold Have A Good ROCE?
One way to assess ROCE is to compare similar companies. Using our data, we find that B2Gold's ROCE is meaningfully better than the 2.4% average in the Metals and Mining industry. I think that's good to see, since it implies the company is better than other companies at making the most of its capital. Separate from how B2Gold stacks up against its industry, its ROCE in absolute terms is mediocre; relative to the returns on government bonds. Investors may wish to consider higher-performing investments.
B2Gold delivered an ROCE of 9.2%, which is better than 3 years ago, as was making losses back then. That implies the business has been improving.
When considering ROCE, bear in mind that it reflects the past and does not necessarily predict the future. ROCE can be misleading for companies in cyclical industries, with returns looking impressive during the boom times, but very weak during the busts. ROCE is only a point-in-time measure. Remember that most companies like B2Gold are cyclical businesses. Future performance is what matters, and you can see analyst predictions in our free report on analyst forecasts for the company.
B2Gold's Current Liabilities And Their Impact On Its ROCE
Liabilities, such as supplier bills and bank overdrafts, are referred to as current liabilities if they need to be paid within 12 months. Due to the way ROCE is calculated, a high level of current liabilities makes a company look as though it has less capital employed, and thus can (sometimes unfairly) boost the ROCE. To counter this, investors can check if a company has high current liabilities relative to total assets.
B2Gold has total liabilities of US$207m and total assets of US$2.5b. As a result, its current liabilities are equal to approximately 8.1% of its total assets. B2Gold reports few current liabilities, which have a negligible impact on its unremarkable ROCE.
The Bottom Line On B2Gold's ROCE
B2Gold looks like an ok business, but on this analysis it is not at the top of our buy list. You might be able to find a better investment than B2Gold. If you want a selection of possible winners, check out this free list of interesting companies that trade on a P/E below 20 (but have proven they can grow earnings).
If you are like me, then you will not want to miss this free list of growing companies that insiders are buying.
We aim to bring you long-term focused research analysis driven by fundamental data. Note that our analysis may not factor in the latest price-sensitive company announcements or qualitative material.
If you spot an error that warrants correction, please contact the editor at editorial-team@simplywallst.com. This article by Simply Wall St is general in nature. It does not constitute a recommendation to buy or sell any stock, and does not take account of your objectives, or your financial situation. Simply Wall St has no position in the stocks mentioned. Thank you for reading.
