
 Yahoo Finance
 Here's What Beiersdorf Aktiengesellschaft's (ETR:BEI) P/E Is Telling Us

Today, we'll introduce the concept of the P/E ratio for those who are learning about investing. We'll look at Beiersdorf Aktiengesellschaft's (ETR:BEI) P/E ratio and reflect on what it tells us about the company's share price. Based on the last twelve months, Beiersdorf's P/E ratio is 33.81. That means that at current prices, buyers pay €33.81 for every €1 in trailing yearly profits.
See our latest analysis for Beiersdorf
How Do I Calculate Beiersdorf's Price To Earnings Ratio?
The formula for P/E is:
Price to Earnings Ratio = Price per Share ÷ Earnings per Share (EPS)
Or for Beiersdorf:
P/E of 33.81 = €110.15 ÷ €3.26 (Based on the trailing twelve months to June 2019.)
Is A High Price-to-Earnings Ratio Good?
A higher P/E ratio implies that investors pay a higher price for the earning power of the business. That is not a good or a bad thing per se, but a high P/E does imply buyers are optimistic about the future.
How Does Beiersdorf's P/E Ratio Compare To Its Peers?
One good way to get a quick read on what market participants expect of a company is to look at its P/E ratio. You can see in the image below that the average P/E (20.7) for companies in the personal products industry is lower than Beiersdorf's P/E.
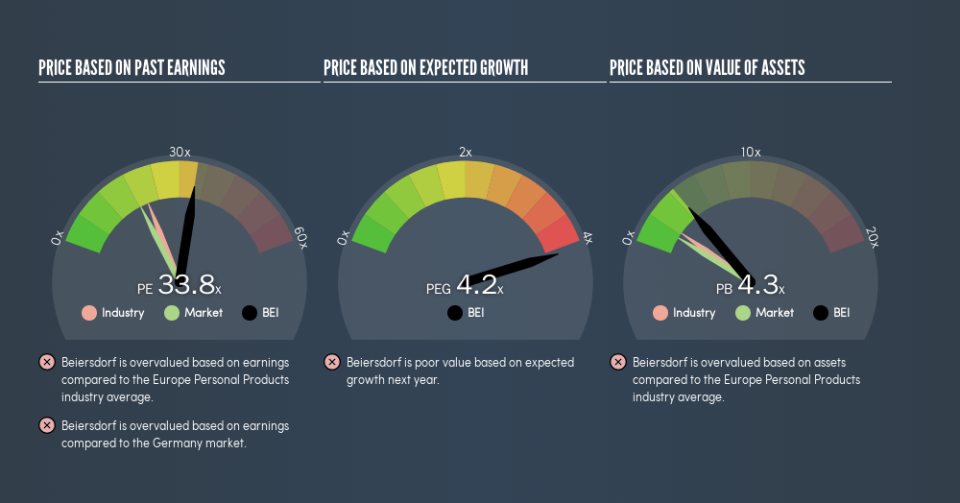
Beiersdorf's P/E tells us that market participants think the company will perform better than its industry peers, going forward. The market is optimistic about the future, but that doesn't guarantee future growth. So further research is always essential. I often monitor director buying and selling.
How Growth Rates Impact P/E Ratios
Probably the most important factor in determining what P/E a company trades on is the earnings growth. That's because companies that grow earnings per share quickly will rapidly increase the 'E' in the equation. And in that case, the P/E ratio itself will drop rather quickly. And as that P/E ratio drops, the company will look cheap, unless its share price increases.
Beiersdorf's earnings per share grew by -8.2% in the last twelve months. And earnings per share have improved by 5.8% annually, over the last five years.
Remember: P/E Ratios Don't Consider The Balance Sheet
Don't forget that the P/E ratio considers market capitalization. Thus, the metric does not reflect cash or debt held by the company. Hypothetically, a company could reduce its future P/E ratio by spending its cash (or taking on debt) to achieve higher earnings.
Such expenditure might be good or bad, in the long term, but the point here is that the balance sheet is not reflected by this ratio.
How Does Beiersdorf's Debt Impact Its P/E Ratio?
Since Beiersdorf holds net cash of €2.1b, it can spend on growth, justifying a higher P/E ratio than otherwise.
The Verdict On Beiersdorf's P/E Ratio
Beiersdorf trades on a P/E ratio of 33.8, which is above its market average of 18.4. Earnings improved over the last year. Also positive, the relatively strong balance sheet will allow for investment in growth -- and the P/E indicates shareholders that will happen!
When the market is wrong about a stock, it gives savvy investors an opportunity. If the reality for a company is better than it expects, you can make money by buying and holding for the long term. So this free report on the analyst consensus forecasts could help you make a master move on this stock.
Of course, you might find a fantastic investment by looking at a few good candidates. So take a peek at this free list of companies with modest (or no) debt, trading on a P/E below 20.
We aim to bring you long-term focused research analysis driven by fundamental data. Note that our analysis may not factor in the latest price-sensitive company announcements or qualitative material.
If you spot an error that warrants correction, please contact the editor at editorial-team@simplywallst.com. This article by Simply Wall St is general in nature. It does not constitute a recommendation to buy or sell any stock, and does not take account of your objectives, or your financial situation. Simply Wall St has no position in the stocks mentioned. Thank you for reading.
