
 Yahoo Finance
 Here's What Brembo S.p.A.'s (BIT:BRE) P/E Is Telling Us

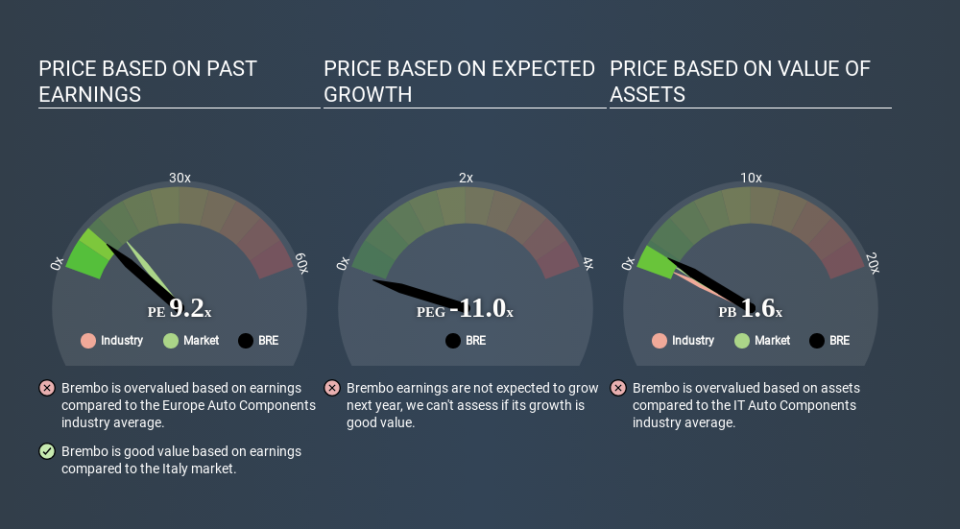
The goal of this article is to teach you how to use price to earnings ratios (P/E ratios). We'll show how you can use Brembo S.p.A.'s (BIT:BRE) P/E ratio to inform your assessment of the investment opportunity. Brembo has a P/E ratio of 9.15, based on the last twelve months. That means that at current prices, buyers pay €9.15 for every €1 in trailing yearly profits.
See our latest analysis for Brembo
How Do You Calculate A P/E Ratio?
The formula for price to earnings is:
Price to Earnings Ratio = Price per Share ÷ Earnings per Share (EPS)
Or for Brembo:
P/E of 9.15 = €6.700 ÷ €0.732 (Based on the trailing twelve months to December 2019.)
(Note: the above calculation results may not be precise due to rounding.)
Is A High Price-to-Earnings Ratio Good?
A higher P/E ratio implies that investors pay a higher price for the earning power of the business. That isn't necessarily good or bad, but a high P/E implies relatively high expectations of what a company can achieve in the future.
How Does Brembo's P/E Ratio Compare To Its Peers?
The P/E ratio indicates whether the market has higher or lower expectations of a company. You can see in the image below that the average P/E (8.9) for companies in the auto components industry is roughly the same as Brembo's P/E.
Its P/E ratio suggests that Brembo shareholders think that in the future it will perform about the same as other companies in its industry classification. The company could surprise by performing better than average, in the future. Further research into factors such as insider buying and selling, could help you form your own view on whether that is likely.
How Growth Rates Impact P/E Ratios
When earnings fall, the 'E' decreases, over time. That means unless the share price falls, the P/E will increase in a few years. Then, a higher P/E might scare off shareholders, pushing the share price down.
Brembo's earnings per share were pretty steady over the last year. But EPS is up 13% over the last 5 years.
Don't Forget: The P/E Does Not Account For Debt or Bank Deposits
Don't forget that the P/E ratio considers market capitalization. That means it doesn't take debt or cash into account. Hypothetically, a company could reduce its future P/E ratio by spending its cash (or taking on debt) to achieve higher earnings.
Such expenditure might be good or bad, in the long term, but the point here is that the balance sheet is not reflected by this ratio.
Is Debt Impacting Brembo's P/E?
Net debt totals just 7.0% of Brembo's market cap. The market might award it a higher P/E ratio if it had net cash, but its unlikely this low level of net borrowing is having a big impact on the P/E multiple.
The Verdict On Brembo's P/E Ratio
Brembo trades on a P/E ratio of 9.2, which is below the IT market average of 13.5. The debt levels are not a major concern, but the lack of EPS growth is likely weighing on sentiment.
Investors have an opportunity when market expectations about a stock are wrong. If the reality for a company is not as bad as the P/E ratio indicates, then the share price should increase as the market realizes this. So this free visual report on analyst forecasts could hold the key to an excellent investment decision.
But note: Brembo may not be the best stock to buy. So take a peek at this free list of interesting companies with strong recent earnings growth (and a P/E ratio below 20).
If you spot an error that warrants correction, please contact the editor at editorial-team@simplywallst.com. This article by Simply Wall St is general in nature. It does not constitute a recommendation to buy or sell any stock, and does not take account of your objectives, or your financial situation. Simply Wall St has no position in the stocks mentioned.
We aim to bring you long-term focused research analysis driven by fundamental data. Note that our analysis may not factor in the latest price-sensitive company announcements or qualitative material. Thank you for reading.
