
 Yahoo Finance
 Here's What To Make Of Countryside Properties' (LON:CSP) Returns On Capital
To find a multi-bagger stock, what are the underlying trends we should look for in a business? Amongst other things, we'll want to see two things; firstly, a growing return on capital employed (ROCE) and secondly, an expansion in the company's amount of capital employed. If you see this, it typically means it's a company with a great business model and plenty of profitable reinvestment opportunities. In light of that, when we looked at Countryside Properties (LON:CSP) and its ROCE trend, we weren't exactly thrilled.
What is Return On Capital Employed (ROCE)?
For those who don't know, ROCE is a measure of a company's yearly pre-tax profit (its return), relative to the capital employed in the business. The formula for this calculation on Countryside Properties is:
Return on Capital Employed = Earnings Before Interest and Tax (EBIT) ÷ (Total Assets - Current Liabilities)
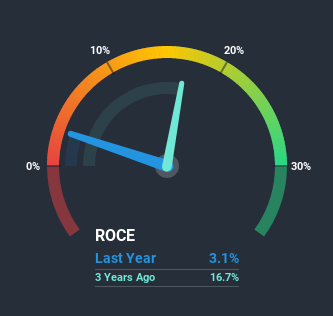
0.031 = UK£38m ÷ (UK£1.6b - UK£361m) (Based on the trailing twelve months to September 2020).
Therefore, Countryside Properties has an ROCE of 3.1%. In absolute terms, that's a low return and it also under-performs the Consumer Durables industry average of 6.7%.
View our latest analysis for Countryside Properties
In the above chart we have measured Countryside Properties' prior ROCE against its prior performance, but the future is arguably more important. If you're interested, you can view the analysts predictions in our free report on analyst forecasts for the company.
What The Trend Of ROCE Can Tell Us
The trend of ROCE doesn't look fantastic because it's fallen from 13% five years ago, while the business's capital employed increased by 112%. Usually this isn't ideal, but given Countryside Properties conducted a capital raising before their most recent earnings announcement, that would've likely contributed, at least partially, to the increased capital employed figure. It's unlikely that all of the funds raised have been put to work yet, so as a consequence Countryside Properties might not have received a full period of earnings contribution from it.
What We Can Learn From Countryside Properties' ROCE
From the above analysis, we find it rather worrisome that returns on capital and sales for Countryside Properties have fallen, meanwhile the business is employing more capital than it was five years ago. Yet despite these concerning fundamentals, the stock has performed strongly with a 43% return over the last three years, so investors appear very optimistic. Regardless, we don't feel too comfortable with the fundamentals so we'd be steering clear of this stock for now.
Countryside Properties does have some risks though, and we've spotted 2 warning signs for Countryside Properties that you might be interested in.
While Countryside Properties may not currently earn the highest returns, we've compiled a list of companies that currently earn more than 25% return on equity. Check out this free list here.
This article by Simply Wall St is general in nature. It does not constitute a recommendation to buy or sell any stock, and does not take account of your objectives, or your financial situation. We aim to bring you long-term focused analysis driven by fundamental data. Note that our analysis may not factor in the latest price-sensitive company announcements or qualitative material. Simply Wall St has no position in any stocks mentioned.
Have feedback on this article? Concerned about the content? Get in touch with us directly. Alternatively, email editorial-team (at) simplywallst.com.
